Oliver Wyman’s Airline Economic Analysis was initially designed to explore the economic fundamentals that drive airline profitability. In 2021, it has become a study of the forces that are undermining it. Thanks to an almost complete shutdown of both business and international travel, the industry faced substantial losses in 2020, and this trend will continue for much, if not all, of 2021.
In fact, it is fair to say that no crisis in modern times has shattered the aviation business model as much as the coronavirus pandemic. That’s because no previous crisis has disrupted corporate and international travel as much as COVID-19. Along with causing a depressed market for domestic leisure travel, the pandemic has managed to wipe out two decades of demand growth in a few months.
Because of COVID-19, almost three-quarters of companies worldwide canceled or suspended domestic travel, and 93 percent canceled or suspended international travel, according to the Global Business Travel Association. Corporate bookings plummeted 85 percent in 2020 and have remained at that level in 2021, based on Airlines Reporting Corp. data. These decisions by companies to keep executives off the road are particularly painful for airlines because business from corporate fliers is their most profitable market segment.
In a normal year, business travel accounts for more than half of airline earnings and nearly a third of total airline revenue in major economies like the United States. Yet high-yield passengers such as executives account for only nine percent of the total flying public. The average high-yield booking produces 4.3 times more revenue than a typical leisure booking.
Leisure rules
As a result, the industry has become dependent on leisure travelers who, despite the pandemic, began to take trips again in the second half of 2020. With these lower-yielding travelers making up a higher portion of a decimated demand, airlines were doomed to see a drop in revenue and substantial losses.
As we were completing this report, the International Air Transport Association (IATA) was predicting that the global aviation industry would not be cash positive until 2022, despite indications from a few airlines that their core operations could be cash positive sometime this year. In November, the association said it expects carrier losses to be an additional $38.7 billion cumulatively in 2021. That’s after losing $118.5 billion in 2020.
In the US, except for spikes at major holidays, passenger traffic stayed around 40 percent of 2019 levels through most of the second half of 2020, based on traveler checkpoint data from the Transportation Security Administration (TSA). It was still only a little over 40 percent for the first two months of 2021.
This tepid demand for air travel also affected fares, particularly fares to destinations popular with business travelers. Looking at 20 US destinations —10 predominantly business and 10 leisure — we found fares in heavily business-oriented markets dropped 33 percent in the pandemic year of 2020 versus 12 percent during the 2007-2009 US recession and H1N1 flu pandemic. Leisure fares, on the other hand, fell 16 percent by the end of last year versus 13 percent during 2009. This disparity underscores the disproportionate impact the absence of higher-paying business travelers has had.
Full-service disadvantage
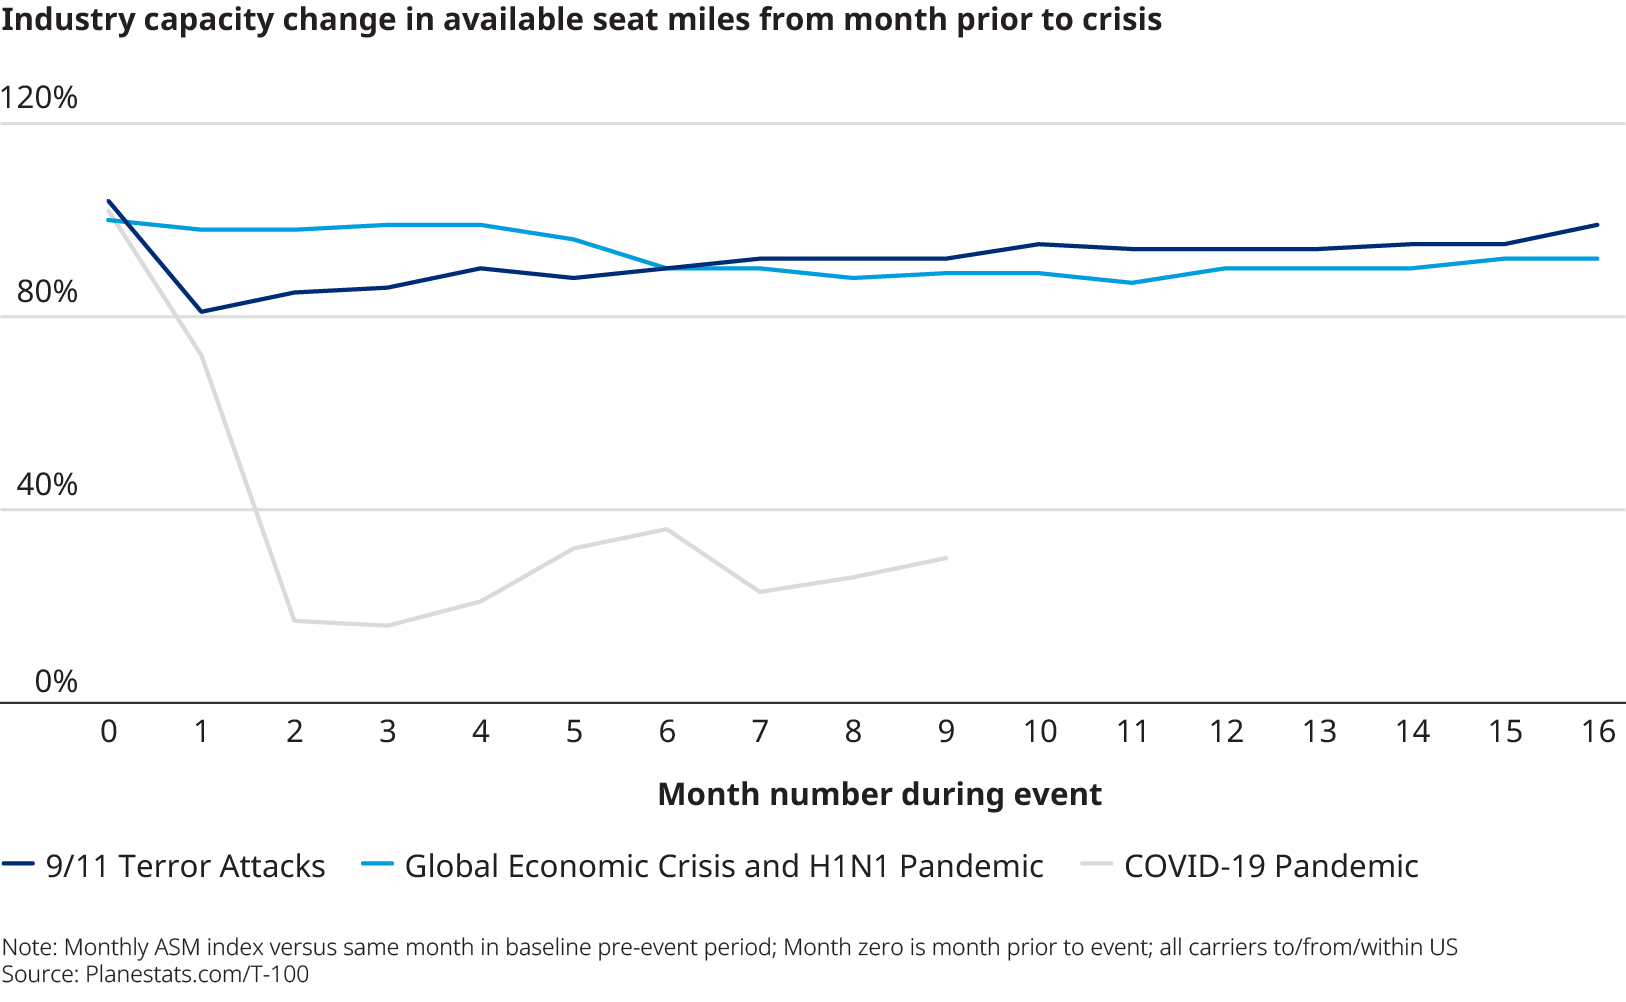
In event-triggered downturns of the past, such as 9/11 and the global financial crisis of 2008-2009, low-cost airlines had an advantage because of their lower operating costs. For those crises, there were similar declines in revenue per available seat mile (RASM) — a benchmark metric used to compare airline revenue performance — across the various classes of carriers.
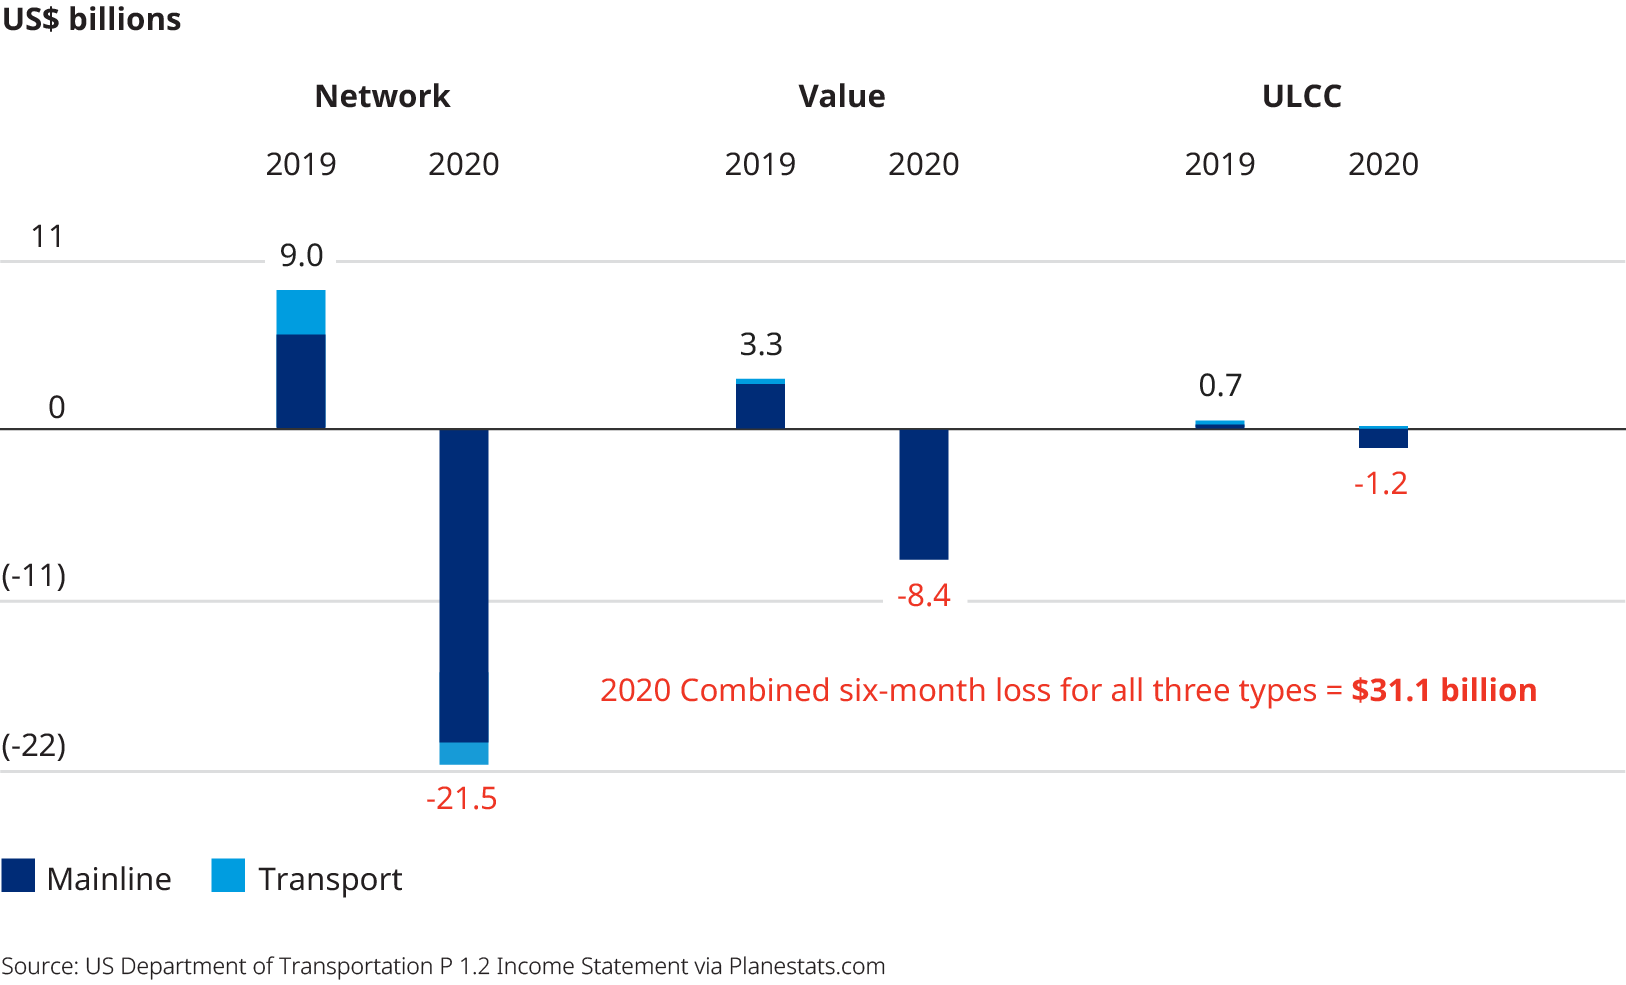
That wasn’t true for COVID-19. Where in the past low-cost carriers only had an operating cost advantage during crises, they now also have a revenue advantage because their primary market — leisure customers — has recovered faster than the business travel market. Our analysis of US Department of Transportation data reveals RASM for full-service airlines fell 50 percent year-over-year in 2020’s second quarter, probably the darkest period for US carriers. Meanwhile, the RASM for low-cost airlines fell 23 percent in the same three months.
The third quarter’s RASM brought the performance of the two airline groups closer together, with full-service carriers declining 45 percent and low-cost carriers down 38 percent. The cumulative for the six months is 47 percent and 34 percent, respectively.
Staying near home
Another missing component from the travel market has been the international segment. Like business travel, the international market dried up because of the various national restrictions preventing or discouraging cross-border trips and fears consumers harbored of having trips canceled or getting stuck in a foreign country. In two global Traveler Sentiment Surveys conducted by Oliver Wyman in 2020 involving nine countries, respondents said their first trips once pandemic restrictions lifted would still most likely be domestic to see family and friends.
The evaporation of international travel hit the airline industries of some regions very hard, particularly those outside the US, where 60 percent of travel is domestic. In Europe, the Middle East, and Africa, only 10 percent of air travel is domestic.
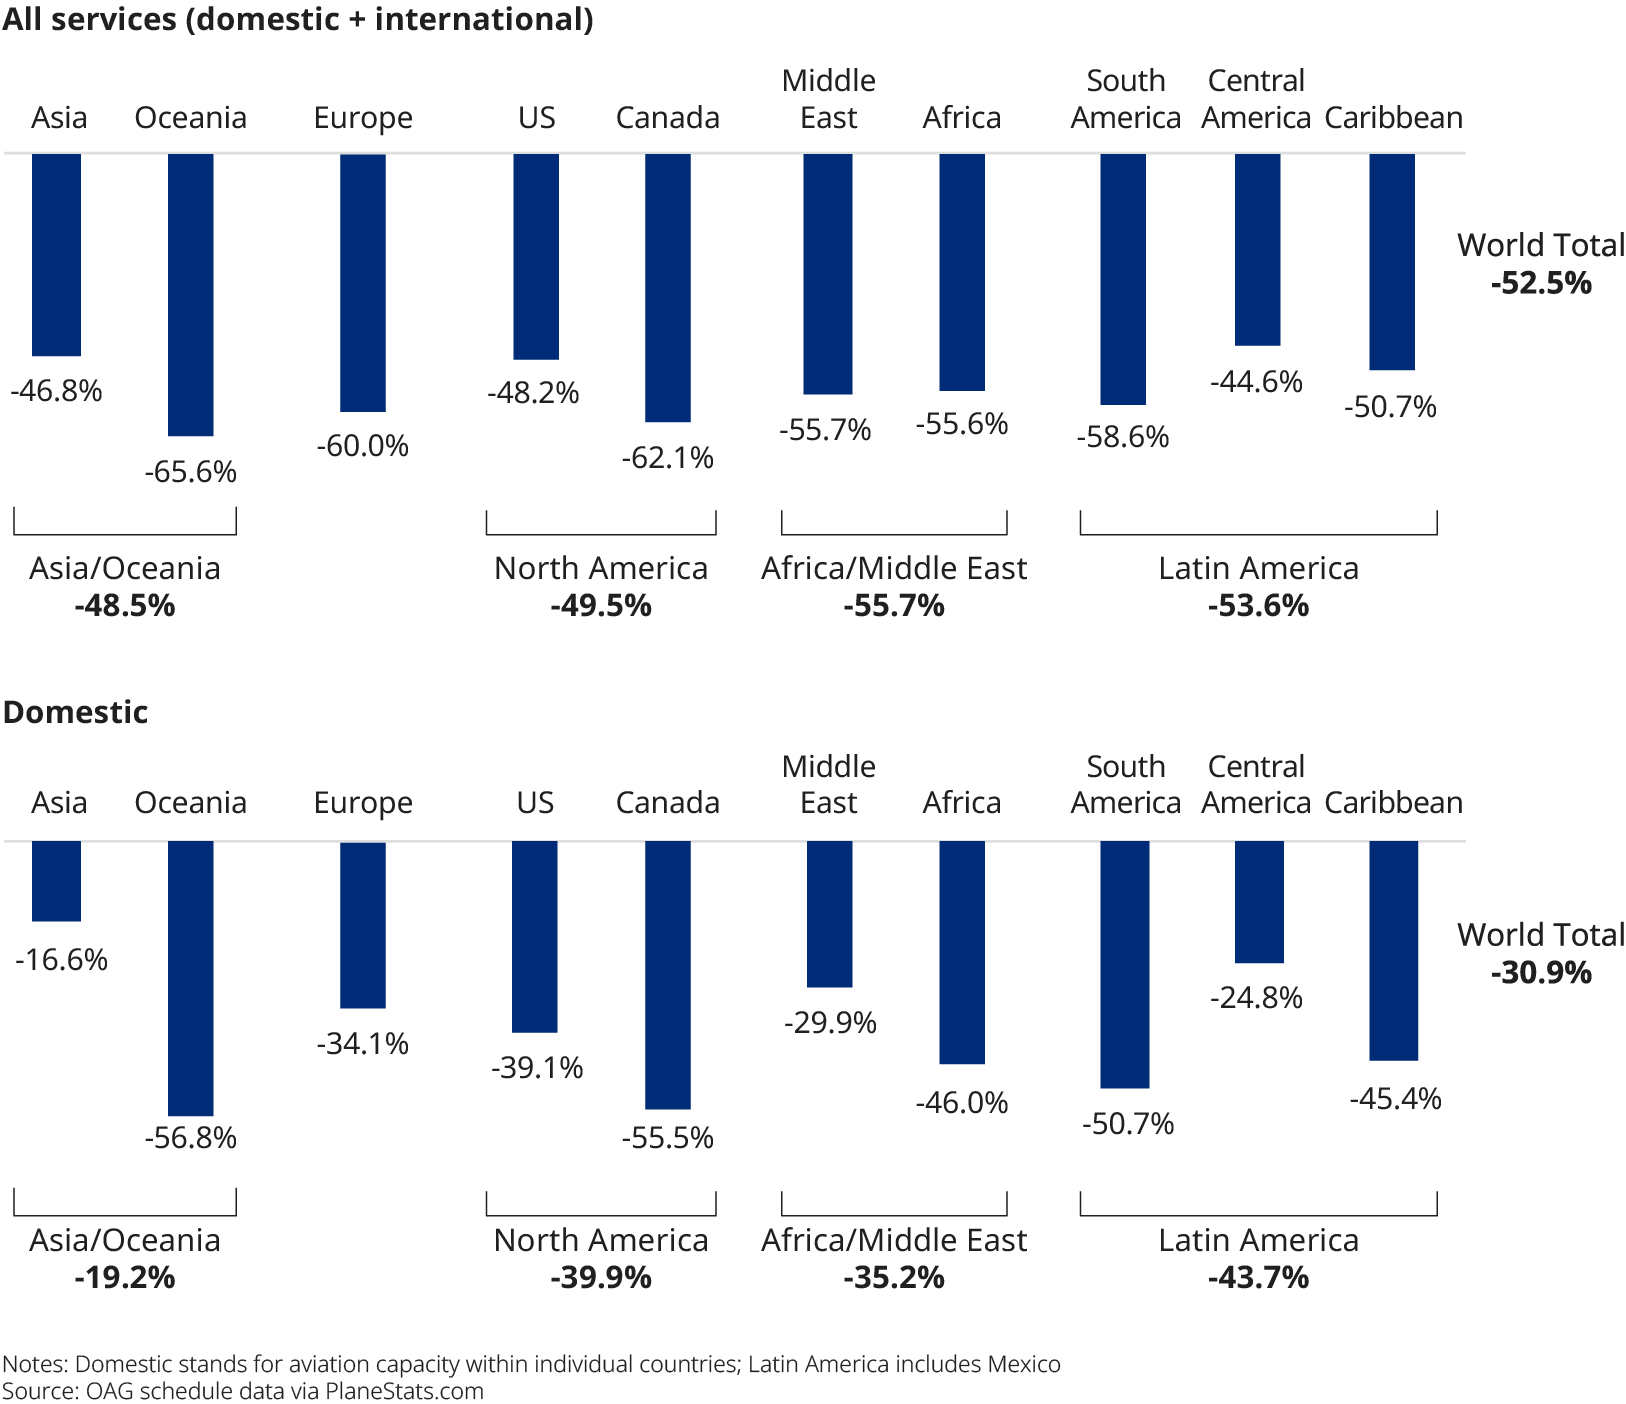
Even in Asia, where nations, such as China, South Korea, and Vietnam, managed to contain the virus in a matter of a few months, international traffic is down more than 70 percent, primarily because of regulations prohibiting cross-border travel. Despite the fact that airlines in these three countries saw domestic demand recover to 2019 levels in 2020, they felt the loss of international traffic. In China, for instance, international travel makes up 45 percent of its aviation market.
For the second half of 2020, global domestic capacity — measured in available seat miles — was down 34 percent while international was down a stunning 75 percent. Besides sending a lot of widebody aircraft into storage and reducing long-term demand for these larger, long-haul planes over the decade, the loss of international traffic killed the tourism in cities like New York and Paris as well as in some developing economies dependent on spending by visitors. That said, the international leisure segment is likely to recover faster than business, as other countries catch up with the US on vaccinations.
Increased competition
In response to the disruption of two important market segments, the bigger, full-service carriers now find themselves in competition with low-cost carriers for price-sensitive domestic travelers and are slowly taking on some of the characteristics of the upper rung of low-cost carriers. Consequently, passengers will likely see more similarity in the fare structure of the two classes in both economy and premium cabins.
Airlines have been unbundling fares in premium cabins to cater to well-off travelers not flying for business but looking to social distance in roomier business cabins. Led by US carriers, a handful of carriers in the Middle East, Europe, and Asia are also pursuing this strategy.
Besides dwindling revenue, airlines are struggling with cutting costs — often pursuing strategies that do not always produce the intended result. During the 2009 economic recession and H1N1 the same year, cost per available seat mile (CASM) increased 10 to 15 percent with every 10 percent reduction in capacity. Why? Unless airlines are running a very effective cost transformation program, operating costs will rarely decrease proportionally with cuts in capacity.
As an example, look at labor costs. Especially for full-service airlines, furloughing workers will often leave payrolls full of highly paid employees with lots of seniority. Take the case of cost-control programs that match expenses to volatile ups and downs in demand: They may ease cashflow pressures but often raise airline unit costs in the short run.
While all types of carriers will face shrinking margins for the next several years, pressure will be the greatest on full-service carriers and international carriers. With the market unable to quickly make up for lost growth, these network airlines will be increasingly forced to shift their strategies toward those of value carriers by appealing to more price-sensitive customers looking for deals.
Changing schedules
To cut overhead and improve efficiency, airlines will have to adjust schedules, reduce unprofitable routes, and shrink the overall size of networks. Behind the scenes, flight hours also need to be adjusted to better reflect the less congested COVID-19 environment and reduce wasted expense. In a normal year, a full-service or legacy carrier may schedule 14,000 flight, or block, hours per day. These drive a lot of operating costs involving crews, fuel, and maintenance.
Typically, most carriers produce, on average, one percent of excess block time. Following 9/11 and during the financial meltdown, that excess time doubled. The reason: As flights operated faster than planned in a less congested, lower-demand environment, ground time made up of unneeded block hours increased. Anticipating and accounting for these effects is an area where the industry has historically left opportunity on the table, failing to eliminate unnecessary cushion time. One percentage point of excess time for an average full-service carrier can easily represent an additional $250 million in annualized cost in a more normal market.
Even so, the aviation industry has historically struggled to make shrinking operations work to its financial benefit. For example, as US carriers slashed capacity during the 2008-2009 global economic crisis and H1N1, their CASM — another benchmark metric — typically increased 10 to 15 percent for every capacity reduction of 10 percent. That’s because airlines have high fixed costs and overhead that can’t be cut at the same rate as capacity.
Vaccine and stimulus
Of course, with recent news from the Biden administration about increased availability of vaccines and passage of the $1.9 trillion American Rescue Plan Act, the outlooks for aviation and the national economy are gradually brightening. On March 15, our health and life sciences team issued an update, predicting that herd immunity could be reached in most of the US by early summer — the second half of June or the beginning of July. That’s three to six weeks sooner than we were predicting in January.
This projection was based on the rapidly increasing distribution of vaccines. Where today the US is handing out more than two million doses a day, it is likely that number could rise to over three million with the additional funds available through the recently passed stimulus and relief package. The Northeast will be one of the regions that emerges earliest, which is fitting as it was the region to be hit hardest in the early days of the pandemic. If the progression toward herd immunity unfolds as expected, then the US could see a relatively rapid pickup in demand for domestic travel sometime this summer. Of course, our calculations assume no big surprises, such as the emergence of variants resistant to the vaccines or a short-lived immunity from the vaccines which could cause COVID-19 to linger — both of which remain risks.
China and a few other nations in Asia already saw that trend, even without a vaccine, thanks to aggressive COVID-19 containment efforts. For example, China’s domestic air travel recovered to 2019 levels in November. The return of international travel is also a question mark, given the plethora of travel restrictions put into place at the height of the pandemic. The sector will take longer to recover than domestic for that reason and may look different as “vaccine passports” and other protocols are likely to be adopted in some places to facilitate a return to normality. We may also see the development of bilateral agreements to permit travel between nations where there has been mass vaccination or infection rates are minimal.
While still in the thick of the pandemic, it’s hard to assess which impacts will leave permanent scars. The disruption in business travel isn’t expected to fully reverse anytime soon, given the existence of mobility substitutes like videoconferencing that provide an alternative to travel and commuting. This is particularly true for internal company travel. As long as these substitutes persist to any substantial degree, the business travel market will constitute the biggest drag on airline earnings for the foreseeable future — one that will force airlines to keep tweaking their business model to compensate. But even beyond corporate travel, this kind of shock will not be forgotten soon.
About the report
After a hiatus year where a thoughtful analysis of the industry outlook in the face of the then rapidly proliferating COVID-19 pandemic was impossible, the report has returned to begin its second decade.
This year’s in-depth report covers a range of aviation industry-specific economic and performance data as well as global capacity during the pandemic. For our 2021 AEA, we expanded our report to be more global in nature, reflecting the worldwide impact of COVID-19, and included forward looking commentary. The analysis outlines the varied pace at which different regions were affected by the virus and will ultimately recover from it.
The report also includes analyses on:
- Capacity changes and available seat miles
- Employment changes
- Revenue per available seat mile (RASM)
- Cost per available seat mile (CASM)
- Load factors
- Operating profit
