
By Bruno Sousa with Dr. Bernhard Hartmann, Dr. Volker Weber and Saji Sam
This article first appeared in the Arabian Oil and Gas magazine.
1. OIL PRICES DOWNTURN INCREASED PROFITABILITY PRESSURE
Since 2014, the Oil & Gas industry finds itself in a new market environment, with oil prices dropping by over 60 percent. In an industry accustomed to prices in the $80-$120/ bbl range, the new price cycle of $40-$60/bbl led to a significant decrease in profitability, impacting shareholder value.
In this environment, companies with the lowest break-even prices will be the winners in the long run. For national oil companies (NOCs), the oil price drop adds to the pressure on profits, given the important role oil plays in supporting the local economy and government budgets. Indeed, some oil exporting countries have seen oil revenues drop by more than 50 percent.
In an industry accustomed to prices in the $80-$120/ bbl range, the new price cycle of $40-$60/bbl led to a significant decrease in profitability, impacting shareholder value
2. OPERATIONS EXCELLENCE AND COST OPTIMIZATION ARE CRITICAL
In this context, NOCs around the world are increasingly implementing ambitious cost-optimization programs, with the objectives of reducing their cost base by at least 20 percent. In Europe, Statoil has already achieved a 20 percent OPEX reduction through rightsizing, and reorganization. In Russia, Gazprom has reduced cost of gas production by more than 30 percent, taking advantage of its high share of Ruble-based contracts. In the Gulf Cooperation Countries (GCC), the Abu Dhabi National Oil Co. (ADNOC) has set an ambitious cost optimization target of 20 percent, having already started to deploy several initiatives such as rightsizing and taking advantage of the unique supply base market opportunities to renegotiate contracts.
NOCs around the world are increasingly implementing ambitious cost-optimization programs, with the objectives of reducing their cost base by at least 20 percent
3. SUSTAINABLE COST OPTIMIZATION HAS FIVE COMMON CHARACTERISTICS
Analyzing this and previous downturn cycles, Oliver Wyman has identified a set of five levers that are common in oil and gas companies that thrive at achieving sustainable cost optimization. Oliver Wyman developed a pragmatic cost-optimization approach based on the five levers. The deployment of this approach should be adjusted to each company’s situation, objectives, capabilities and culture.
Oliver Wyman has identified a set of five levers that are common in oil and gas companies that thrive at achieving sustainable cost optimization
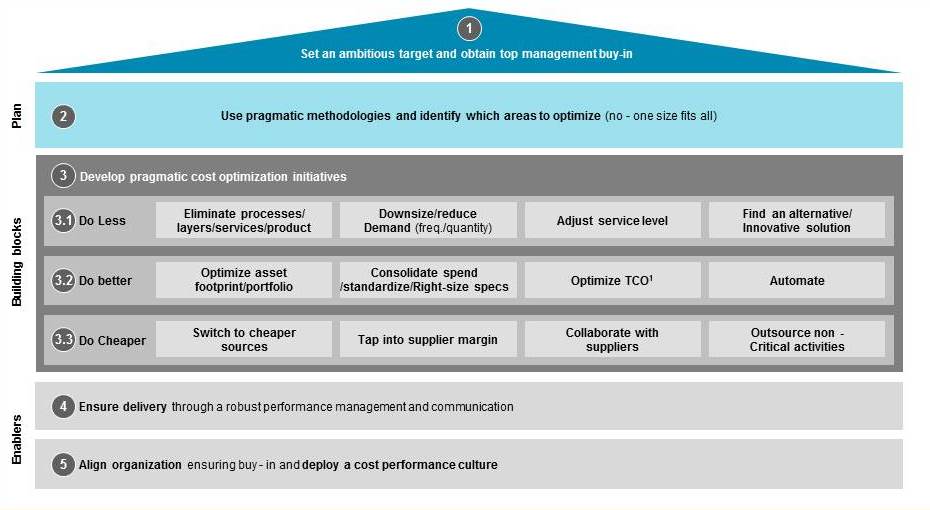
1. Set ambitious targets and obtain top management buy-in. Perform a high level, cost due diligence across assets and peers, to set a cost optimization target, and then stick with it and make well known to the organization. For example, the CEO of GCC NOC set a bold cost optimization target that has cascaded down to all the business units, which are now working hard to achieve the objectives.
2. Plan which areas to optimize by using pragmatic methodologies. Follow a structured and systematic approach to identify key areas for improvement and potential quick wins. One pragmatic method is to develop a profitability tree[1], mapping the key cost drivers and identifying the areas to focus on. Moreover, it’s important not to get locked into a “one size fits all” approach, where costs are cut equally across the board, as this may hinder the company’s ability to achieve long-term savings. For example, an international oil company (IOC) set different cost optimization targets for personnel, supply chain, maintenance, and logistics to achieve its target exploration and production (E&P) operating costs reduction. In addition, top-performing assets and affiliates were identified to set internal optimization targets following a “best of breed” approach.
3. Develop pragmatic cost optimization initiatives that are impactful and implementable. For the purposes of this article, we have segmented the universe of optimization levers available to oil and gas (O&G) players, into three types of no regrets initiatives: Do Less, Do Better, and Do Cheaper
A. Do less types of initiatives focus on eliminating redundancies, reducing demand, and finding alternative supply options. For example, a large NOC used a zero-based budget approach where the business areas need to justify which costs to maintain vs. which costs to eliminate. This led them to eliminate unnecessary supplier costs in their downstream operations by increasing in-house operations in areas such as preventative and light maintenance.
B. Do better types of initiatives focus on renegotiating key supply contracts, consolidating volumes across sites, standardizing specifications, and deploying TCO[2] for key spend categories. For example, a GCC NOC introduced such measures to increase equipment standardization across sites, enabling them to significantly reduce their maintenance spending in spare parts. In other instances, companies deployed supplier collaboration initiatives and introduced global innovations to jointly drive costs down by increasing equipment yields and reducing consumables.
C. Do cheaper types of initiatives focus on applying levers such as localization, low-cost country sourcing, or outsourcing. These types of initiatives are being deployed across the board. For example, Saudi Aramco has deployed IKTVA[3] to foster local content development and promote cost savings. In another case, a large GCC downstream player introduced suppliers from low-cost countries, enabling it to save up to 30 percent in some cost categories, such as valves and pumps. Furthermore, QP outsourced part of its non-core operations, such as catering and insurance, to reduce its cost base and focus on its core business
4. Ensure delivery through a robust performance management and communication. Cost optimization initiatives and targets should be tracked and monitored to ensure the savings are captured and not spent elsewhere. A large GCC NOC deployed an e-based PMO to easily track the initiatives success and communicate results to the organization. As an enabler, it is important to create the right level of cost transparency in the organization. For example, the CEO of a GCC NOC systematically asks his team what is their profit per barrel, and some companies display their daily margin per barrel across company buildings.
5. Align the organization and implement a cost performance culture. To ensure cost optimization targets are met its important to involve all levels of the organization, particularly “operational” teams that have key insights on where and how to optimize costs. For example, an NOC in the GCC created an idea box and a web-based savings tool accessible all employees to identify potential cost optimization initiatives. In another case, a large IOC used a bottom-up approach to identify cost savings by organizing multiple workshops with operational asset teams around the world. This created a case for change and buy-in in the organization that were critical in implementing and delivering any cost optimization program. Of all the five levers, this is perhaps the most important.
Below is a summary of our cost optimization approach and it’s the five levers. It is important to note, that while this approach is drawn from our experience in the oil and gas sector, it can be deployed with minor adjustments in other private sectors or even in the public sector.
Case Study
Petronas in response to rising costs and declining oil prices launched an industry wide program, CORAL 2.0 (Cost Reduction Alliance) involving 25 operators. Under CORAL 2.0, there are 11 identified initiatives to activate three value levers; [3] Proactive Demand Management, (2) Spend Consolidation, and (3) Driving Innovation. CORAL 2.0 aspires to inculcate a cost conscious mindset and culture across the industry, to guide industry towards a world class performance by benchmarking cross-industry, and to increase collaboration to infuse global best practices into Malaysia E&P. This program has a targeted potential annual cost saving of USD 0.9 to 1.7 BN by 2019, has already enabled Petronas to reduce CAPEX by 28%, and OPEX[1] by 9% from 2015 to 2016.
[1] Profitability tree breaks down a company’s free cash flow into its main drivers (i.e., revenues, OPEX, capex and working capital)
[2] TCO - total cost of ownership considers all direct and indirect costs associated with a given purchase throughout its lifecycle
[3] IKTVA – In Kingdom Total Value Add Program to baseline, measure and support increased levels of localization in the Kingdom of Saudi Arabia