Supply chains are inherently complex. They span multiple companies—often up to tier 3, 4, or 5 suppliers. Each company collects data in its own silo, often within different silos for each company. Consequently, there’s no full end-to-end transparency on supply-chain performance: cost, service levels, operational KPIs. Moreover, because every entity in the supply chain defines its own performance measures, there are no overarching performance metrics.
In the age of digitization, the lack of transparency is getting worse all the time, as the scale, scope, depth and dynamics of supply-chain data increase complexity
To measure progress against your strategic goals, the data you need may be hidden along the supply chain, or may not be measured at all. For example, if one of your strategic goals is quality delivery service, you need data from other players to measure your progress. You need to pull together data from different sources in real time on one platform for a clear view of the supply chain.
In the age of digitization, the lack of transparency is getting worse all the time, as the scale, scope, depth and dynamics of supply-chain data increase complexity:
- Scope increases as vertical integration is abandoned in favor of outsourcing and specialization, with each partner taking a very tiny piece of manufacturing/fulfillment process— as well as logistic providers / brokers / wholesalers in between. This results in multi-echelon, intertwined webs around the world with an increasing number of countries, suppliers, and customers generating pieces of data.
- Scale increases with structured or unstructured data from each partner (forecasts, CRM transactions, transport optimization), semi-structured data (delivery times, RFID, GPS), and unstructured data sources (such as social media, weather forecast, call center logs).
- The actual volume (depth) of data increases at each step: master data (product, customer, supplier); process data (temperature, transportation route, waiting times); and finance data (invoicing, payment transactions). Add professionalized data analytics (modeling, optimization, prediction) and the depth increases even further.
- Finally, data dynamics are changing, as real-time data is available—GPS for route optimization, live and direct customer feedback either company initiated (NPS) or customer initiated (social media). In addition data life cycles are shortening—it’s coming faster and faster.
Data, Data Everywhere (and not a drop to drink)
Given such a chaotic stew of data, how can you make decisions based on data to improve supply-chain performance metrics on cost, service, and quality? How do you get consistent data with a single source of information for the end-to-end supply chain? How do you peer into relevant data across the whole supply chain? And how do you do this in an agile, real-time fashion?
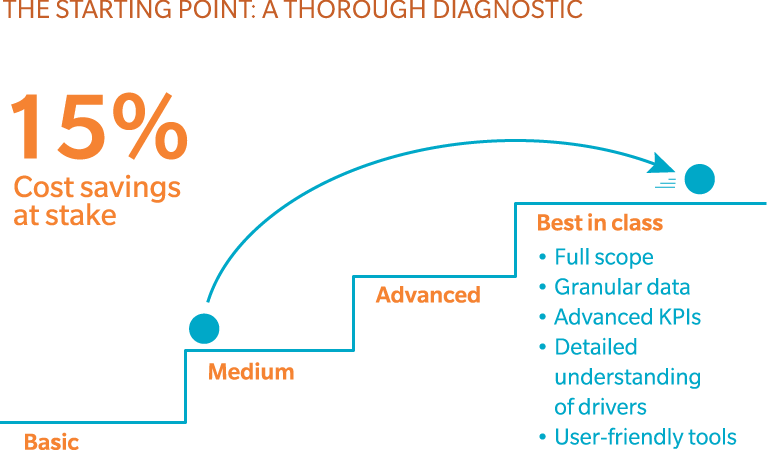
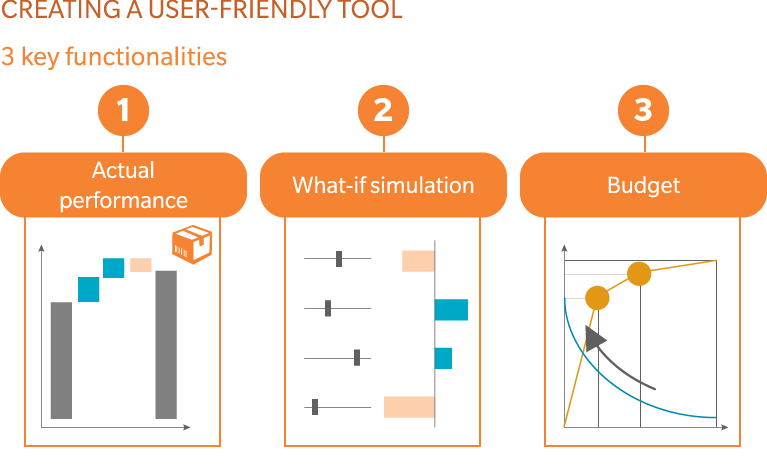
Existing solutions often fall short. Most executives say they understand how big data solutions will develop their supply chains, and many expect to achieve a cross-functional view—but the vast majority have not implemented solutions integrating key functionalities such as performance tracking, scenario simulation and budgeting processes. And many of those solutions are not in real-time but require a lot of manual work—even though time is critical when talking about disruptive events. The financial impact is massive and industry examples show more than 15% cost saving potentials.
A 3-Step Solution
The solution to supply-chain transparency requires a 3-step process.
- Design (greenfield) an end-to-end supply-chain watchtower that fully aligns with your strategic objectives. Your strategy and business model will determine the KPIs and their target values. They should be customer-oriented—focusing on service, cost, and quality.
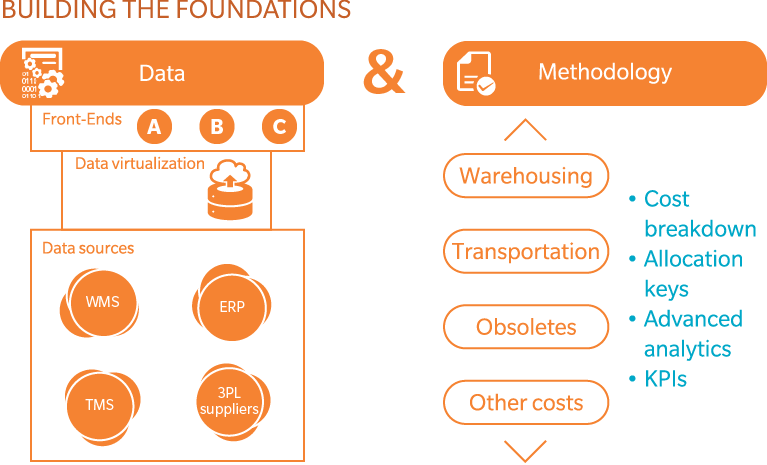
- Identify and connect data sources using a data virtualization tool. Data virtualization allows quick and easy integration of structured, semi structured, and unstructured data—in all formats (RDBM, data warehouse, big data, cloud, social media, newsfeeds, Excel or PDF files, …). The data arrives in real-time through a standard interface. A single-view portal allows connect to enterprise applications/ BI and analysis tools. State-of-the-art data virtualization solutions allow searching massive databases with more than 100 million rows in milliseconds vs. > 10 minutes in classical database systems.
- Adjust processes and organizational structure. With the strategy defined, the KPIs set up, and information made available, redefine the supply-chain processes (planning) and organizational structure (decision power) to actually exploit opportunities and align decisions along the supply chain.
This 3-step solution integrates the necessary data on one platform—allowing you to make better and faster decisions based on data tied to your strategic objectives.
How Social Media Can Impact The Supply-Chain
With the launch of a new consumer product, the supply chain needs to deal with unknown customer demand and adoption, which immediately impacts all players along the supply chain. But making customer feedback on social media transparent will generate timely and valuable information for the entire supply chain:
- Stores can use such information to calibrate orders and avoid to large or too small inventories.
- Inventory levels will determine transportation volumes and routes that need to be quickly adapted by 3PL to maintain service levels.
- Distributors may rethink their market strategy, or learn about regional differences that could increase or decrease sales
- Producers may need to remodel lot sizes and frequency to maintain cost efficiency—or may increase quality to better meet market demands.
Overall supply-chain performance depends on the velocity and consistency of information—because that data affects multiple decisions that eventually impact all players.