
As more organizations become better in applying data and analytics, the value is no longer merely incremental or marginal — but table stakes to compete. The game-changing value of leading with data and analytics impacts both sides of the balance sheet:
- Revenue Growth. Predictive analytics allow more precise targeting of customers and the impact of different pricing regimes, with quicker reaction to market dynamics.
- Deepened Customer Loyalty. Finding signals in customer behavior to uncover their underlying needs allows customization of offers and products to better suit them.
- Greater Efficiency. Isolate and quantify cost drivers or efficiency drains. Enable managers to make split-second decisions by making data and recommendations available in real time.
- Reduced Risk And Operational Losses. Identify pockets of risk before they become costly. Anticipate customer churn well in advance, with enough time to plan for retention.
Many managers know what a data-driven organization looks like:
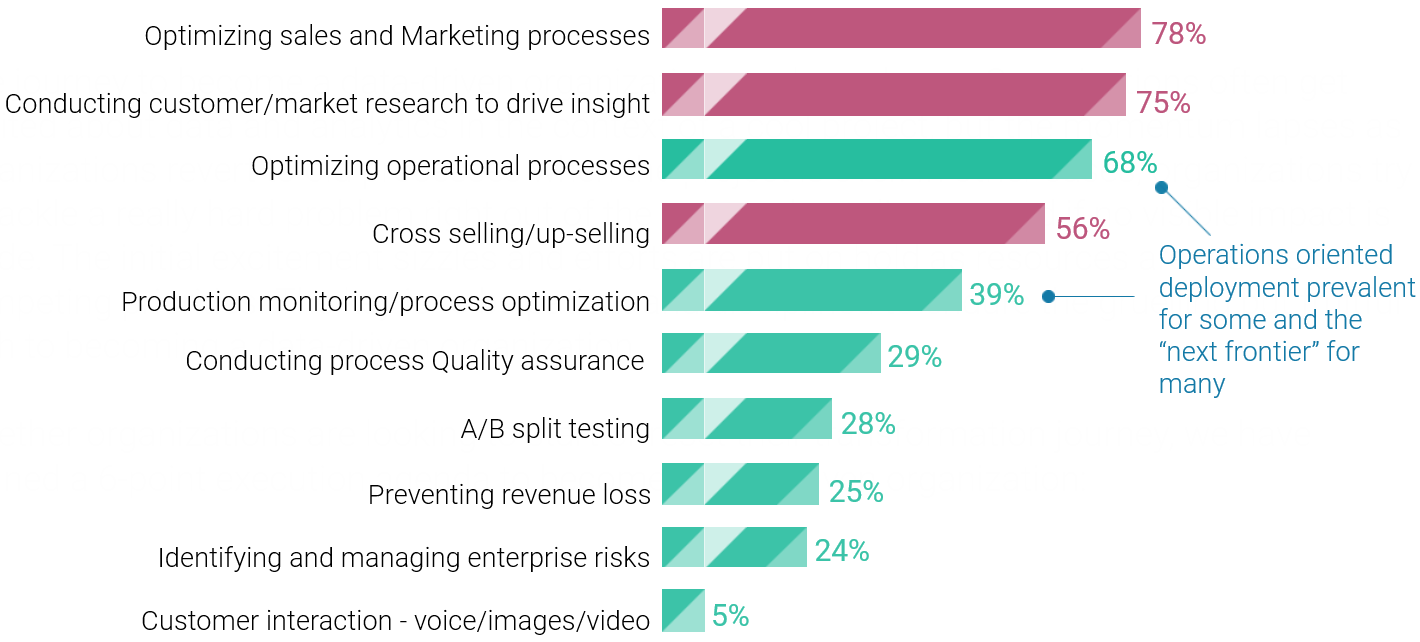
- Forward Looking. The strategic role of data and analytics shifts from ex-post use cases of historical reporting and performance review to ex-ante predictive analytics.
- Company Wide. The use of data and analytics is fully scaled and operationalized with applications to thousands of small decisions.
- Full Toolkit. A set of core capabilities—such as data sourcing, standardized analytical tools, analytical models/techniques—is available to all lines of business for a range of use cases.
- New Breed of Professionals. The data talent bench is refreshed with new experts and groomed in-house talent, including “tweeners” who understand both business and technical issues.
- Easy Front-End Access to Data. Centralized and connected authoritative data sources that describe a “single version of truth” are accessible to employees for analysis, decision-making and reporting.
- Centralized Data Governance. Data is a strategic asset across the organization, with formal procedures and accountability to maintain accuracy and timeliness.
- Metrics for Benchmarking. The business impact contributed by data and analytics is continually measured through a set of KPIs.
But, for incumbents saddled with legacy IT systems and siloed organizational structures, transforming into a data-driven organization presents challenges:
- De-Centralized, Non-Conforming Projects. Data-and-analytics capabilities are too often scattered across the enterprise with little consistency or meaningful linkage; consolidation is often difficult because of political barriers.
- Talent Gap. Most firms have never hired people with good data instincts or skillsets, or made it a priority to do so. And the supply of trained data engineers and scientists falls far short of current demand.
- Poor Governance: Data quality suffers when it isn’t managed. Many firms have internally inconsistent or incomplete data, conflicting definitions, and manual processes that inhibit scaling.
- Fear-of-Failure Culture. Few companies foster and reward experimentation. IT tries to make sure things “don’t break,” and analysts more often work on reports than front-line decision support. Making data work requires a culture of innovation and agility.
- Legacy IT. Many firms’ IT systems and software platforms grew haphazardly into what is now an unwieldy “stack,” with data held in disparate databases and formats.
- Complex New Architecture. Wiring next–gen systems to source, clean, and process data is tricky and demanding work. Huge data volumes present new technical challenges and pose new cyber-security risks.
Whether organizations are looking to start or reset their transformation journey, we have defined a six-point execution agenda to become a data-driven organization:
1. Lead From The Top
HowChampion the case for data in the C-suite level and escalate that commitment publicly to give the organization a rallying cry. Expand accountability to the Board and shareholders; send clear signals to empower employees to align their efforts and priorities.
Define the role of data in the broader corporate strategy. Commit financial investment aligned with the overall strategic ambition, and establish an R&D budget for data and analytics.
Make a business case for data in all units. A common pitfall is that organizations assume people understand the value of data and thus don’t feel they need to make a business case. Without defining and showing the tangible benefits of data, many data initiatives will be sidelined by competing priorities.
Example
A global consumer packaged goods company enforces a data-analytics driven mandate through use of physical and immersive data experiences. For example, digital walls outside offices constantly stream live data, from product performance to consumer insights. The Board room is set up in a ‘minority report’ style, with screens surrounding senior executives and Board members. These digital walls are not just for show; they are actively used for strategic decision making.
The physical presence of digital walls sends a strong signal across the organization that leading with data and analytics in every decision, big or small, is part of the business culture. Senior executives reinforce this culture by requiring supporting facts to justify decisions and consistently benchmarking performance against metrics.
2. Take Action Where It Matters - Quickly
How
Pour energy into rapidly solving problems that will make a business case for data. You will generate greater momentum when addressing a business problem or opportunity rather than selling a generic “data initiative.”
Success that proves real value and ROI can help data initiatives become self-funding, which creates an argument for investment in data infrastructure. You can leverage the resulting impact as impetus to continuously address new problems, as you diversify efforts across multiple lines of business and functions. Make data and analytics a priority in every corner of the firm.
Measure the impact of data and analytics with KPIs that demonstrate business value. Provide data points/facts to determine how to improve or when to pull the plug.
Example
An investment management company declared data was a strategic asset to drive firm-wide growth and operational efficiency in its five-year vision, and immediately began to showcase the potential. Rather than relying on just its own internal data, it sourced and integrated more external historical market data for fundamental analysis. Rather than using static data for portfolio analysis, it used real-time prices of securities for more timely and accurate views. During a crisis, such as a credit, economic, or natural disaster, the firm aggregated all its exposures to better identify and protect against risk.
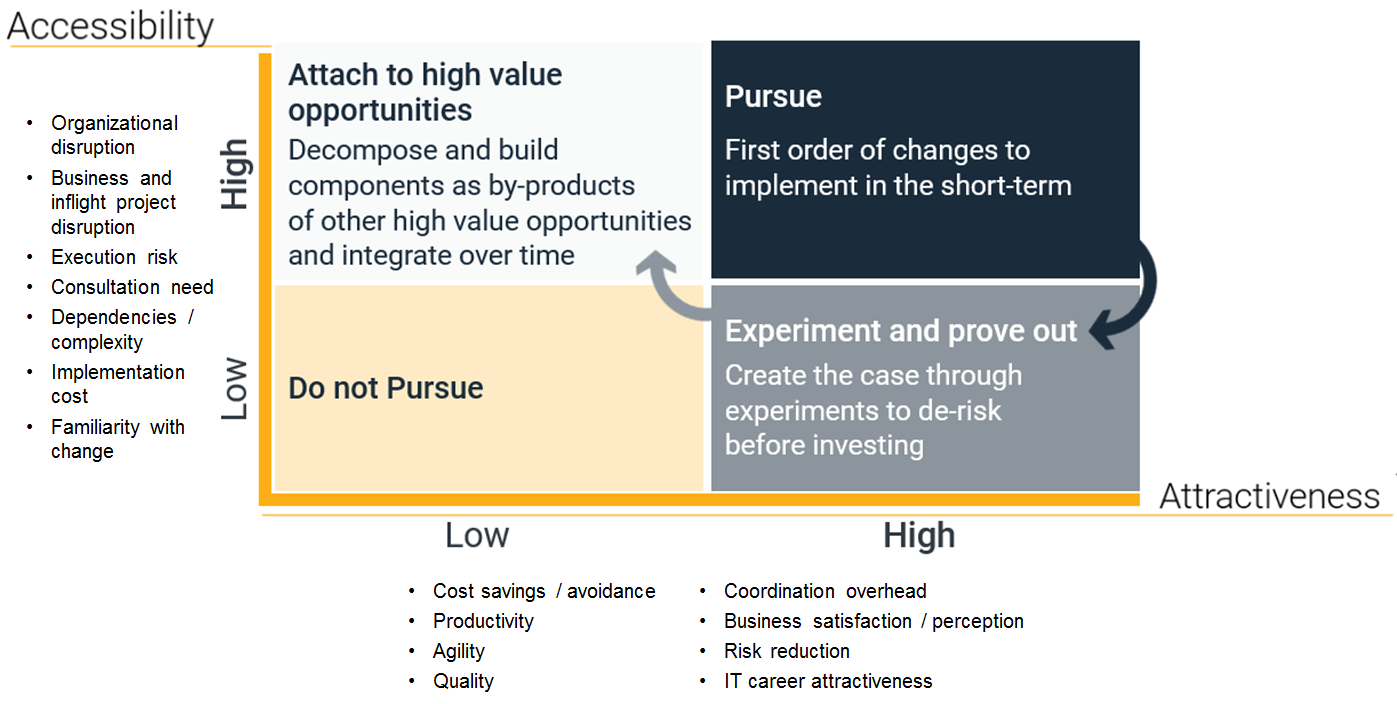
Finally, it used data to establish a prioritization framework to support sequencing of investment by balancing two opposing dimensions: The attractiveness (revenue uplift, cost efficiency, risk reduction, productivity, agility) and accessibility (implementation cost, execution risk, dependency/complexities, reuse, probability of success) of an investment.
Investment Management Company Case Study
Framework to prioritize data and analytics opportunities for investment
3. Industrialize And Scale
How
Moving data and analytics from the lab into the real world requires concerted efforts on three fronts:
- Technology. Avoid getting trapped in another huge infrastructure project as you look to develop agile technology. One way to do that is by renting capacity from large tech firms to flexibly scale without significant capital investment. Another way is to use open-source tools and inexpensive commodity hardware. Design for scale with processes that continuously ingest a large volume of data and automatically conjoin, format, clean and enrich that data.
- Process. Take an agile approach for rapid iterative launch cycles. Break solutions into modular chunks that can be deployed incrementally, rather than a big-bang deployment of the full solution, which introduces significant execution risks and could delay launch.
- People. Develop multi-disciplinary, agile teams that bring together business operations, data scientists, data architects, and IT experts to reduce the number of hand-offs. Groom “tweeners” who understand both technology and business issues. Institutionalize business-as-usual functions to remediate production issues, tune data algorithms/analytics, and continuously improve data processes.
Example
The core business of a global financial information and analytics company is responsible for research and ratings for a broad range of investment instruments across multiple asset classes. Operating in over 25 countries, the company employs thousands of analysts to consume and generate a significantly high volume of data and analytics. However, the ratings process across different divisions were operating like local craft shops, with varying standards and consistency, resulting in over $1 BN in regulatory fines, poor operational controls, and high operating cost.
The organization embarked on a transformation journey to industrialize its processes by:
- Simplification. 32% process steps and 48% hand-offs reduced.
- Standardization. 64% process steps and 19% roles standardized.
- Controls. 41% stage gate decisions embedded in process.
- Automation. 30% manual steps automated end-to-end.
Over three phases, the transformation took place:
- Phase 1: Prototype. Five two-week sprints to design and create early prototype of workflow and user interface.
- Phase 2: Test and Learn. Create minimum viable product and pilot through a learning launch with 5% of analyst population.
- Phase 3: Scale Operating Model. Extend rollout in more rigorous standard release management mode across geographies and divisions. Gradually transition remaining users over 12 months in 25% increments.
4. Fix The Plumbing, Where Needed
How
Improve the data architecture incrementally in the context of builds for specific data solutions. Fix the plumbing where it is in the critical path and ensure the fix aligns with the target architecture:
- Data Storage/Access. Centralized sources facilitate efficient access for both structured and unstructured data.
- Data Flow/Lineage. Optimize the path over which data should flow across the organization to minimize redundancy and unauthorized use.
- Data Standards. Govern how data is managed throughout its lifecycle to ensure consistent use across the organization. The plumbing is not just the technology that manages the physical aspects of data—but the blueprint for how employees handle the data.
Example
A large telecommunications company had access to petabytes of data, but no dedicated data-analytics function. It spent time and money building out data lakes, without discussing appropriate cleansing and quality assurance with business units. Data Scientists, for example, did not have a contextual business understanding of the data and were unable to validate its accuracy, such as determining whether price data aligned with various internet plans. As a result, the telecom had low confidence in the data, which severely limited data-driven business decision-making.
To establish trust in the data, the telecom had to establish a foundation to ensure common understanding of the data across the organization and ongoing quality assurance. That included data lineage (where did the data come from and how did it travels across systems?), data definition (what does it mean in different business contexts?), and contextual checks (Data Scientists established KPIs that measured congruency of data, to flag products if revenue fell above or below a certain threshold).
By investing in these basics, the telecom ensured that “anyone” could do analytics, increasing scope and speed of analytics. Because people began to trust the data’s provenance, there was no need to double- or triple-check data. The accuracy of data increased the viability of analytics.
5. Align Organization And Talent
How
Align the organization from top to bottom and define new organizational constructs. Link accountability for data to objectives at the department, team, and personal level. Establish a dedicated data-management function to formalize data’s role in the organization. Create governance mechanisms to eliminate artisanal data shops, and adhere to global standards for use of data.
Competition for top data-and-analytics talent is tough given the limited supply, so consider alternative talent strategies. Source and nurture raw talent by building the bottom of the pyramid with recent grads from local universities; groom them over time through an apprenticeship model and continuous external training. Establish rotational programs to develop “tweeners,” who understand both business and technology, and can bridge the divide between silos. For more advanced talent at the top of the pyramid, crowd-source from the external data-scientist community through competitions. And practice what you preach: Apply analytics to recruiting data talent.
Manage change gradually where resistance is evident. Real change won’t happen in the context of a single project, but needs to be fostered over time. Embed change agents at the grassroots level, and look for continual leadership endorsement.
Example
An insurance company established an analytics team across the organization, and applied analytics in pricing, risk, claims and fraud. With each success, every line of business (LOB) invests more, building separate capabilities within life insurance, investments, and annuities.
Over time, this ad hoc approach began to strain the overall data infrastructure, creating inefficiencies, redundancies (separate pipelines built to extract similar data from source systems), and internal competition for talent.
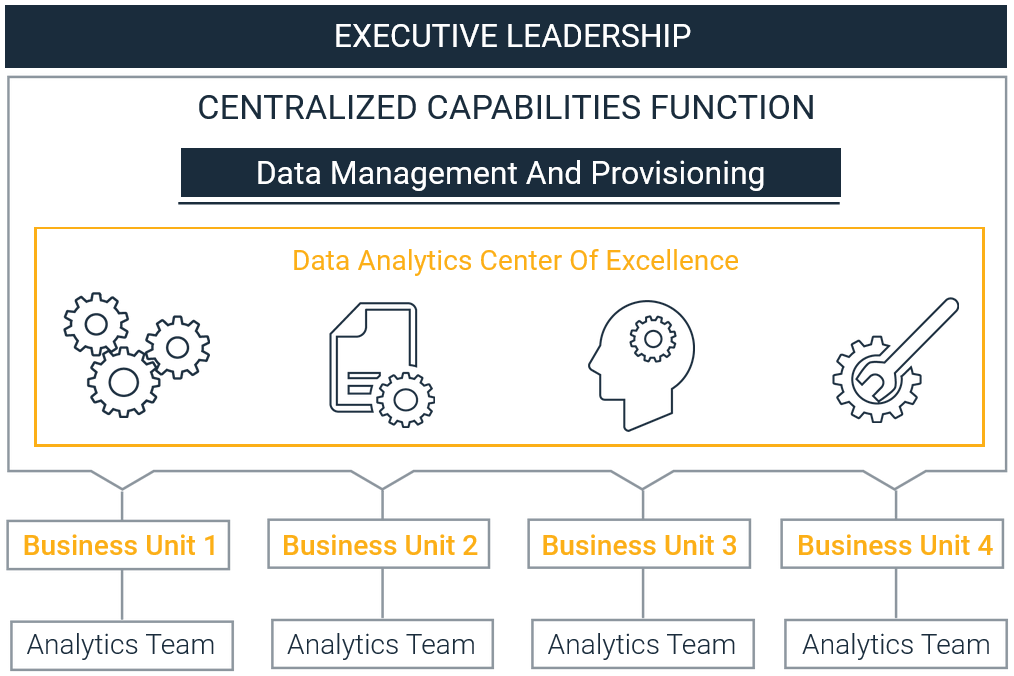
In response, the CEO decided to elevate data and analytics as an enterprise capability by establishing an integrated data-and-analytics operating model. He created a Chief Data Officer (CDO) position reporting to the CEO, with responsibility for the new centralized data-and-analytics center of excellence (COE). Resources (data sourcing, ingestion, quality assurance) within this COE are fungible and can be deployed for LOB projects; on the other hand, each LOB will continue its own data-and-analytics activities, adhering to standards and policies set forth by the COE. The COE is staffed with data scientists who maintain a library of best-in-class analytical tools and algorithms, conduct complex, experimental analytics, and optimize business-as-usual analytics to achieve an incremental uplift for greater accuracy and precision.
Insurance Company Integrated Analytical Model
6. Spotlight Success While Letting Failure Be Acceptable
How
Share success stories across the organization, but also praise the most useful thing that didn’t quite work to illustrate how much is learned through experimentation. Encourage individuals to take risks by experimenting with new ideas—failing, learning, and iterating, and continuously repeating the cycle.
Conduct post-mortem reviews of failures to codify learnings and understand how to apply them to future projects and experiments.
Example
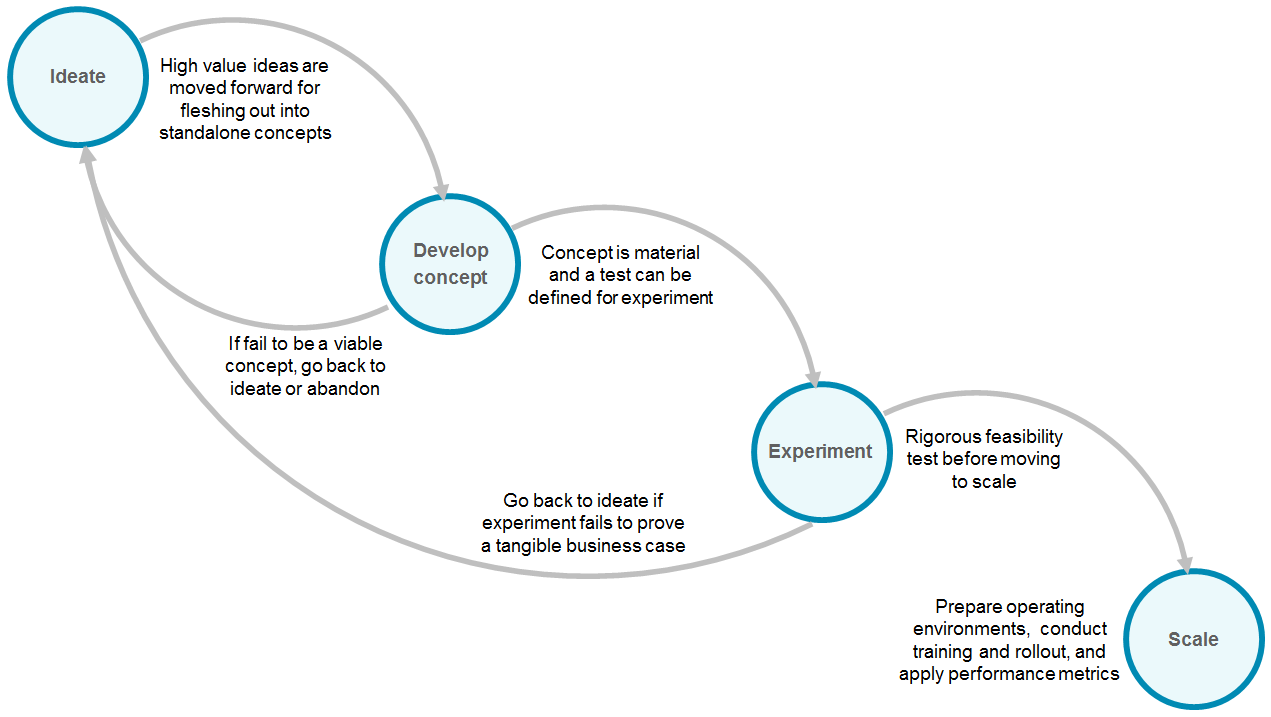
A large industrial transportation organization pursued a data-driven, customer-driven operating strategy to support demand forecasting and increase understanding of customer needs. The firm collected petabytes of data from equipment sensors, telematics, and supply-chain systems, which made gleaning insights like finding a needle in a haystack.
To rapidly generate and test ideas about how to apply data and analytics, the CEO fostered a culture of experimentation in which fail-fast was acceptable. Failure became a form of learning and continuous improvement rather than something to hide. Whenever an experiment failed, the immediate next step was to conduct a post mortem to understand what could be learned for the next iteration.
This fail-fast, learn-fast culture encouraged employees to take risks and explore opportunities outside of traditional boundaries. The impact was measurable. The firm helped airlines to operate more reliably and efficiently by enabling and supporting fuel-management optimization, route optimization based on flight conditions, and increased speed of parts delivery and enhanced inventory management. For example, one idea led to predicting the optimal cost of which parts to store in inventory and which ones to create in real-time using 3D printers.
Large Industrial Transportation Organization
The journey to become a data-driven organization can be arduous. Organizations often get excited about data and analytics in the context of a cool project, but the momentum lapses as organizations revert to old processes when the project is over. In other cases, organizations try to tackle a really hard problem right out of the gate and get discouraged if no visible impact is made. The initial excitement fades and efforts are put on hold as resources are redirected to competing priorities. The key is to be patient and disciplined to endure the grueling but fruitful path to becoming a data-driven organization.