
Even living through this pandemic, it is a struggle to fully comprehend the impact of this crisis. Every aspect of economic activity has been affected. In these uncertain times, questions arise about the trends seen across industries as well as the future implications. Within the world of hazard insurance, premium rates and loss experience of property casualty insurance coverages have always been highly correlated with economic activity. This is especially the case with title insurance, where loss experience has always been highly correlated with the real estate market and the general economy. The current situation, however, is somewhat unique. Millions of homeowners are at risk of default on their mortgages due to job losses, while at the same time millions of others are either purchasing new homes or refinancing current mortgages to take advantage of extraordinarily low interest rates.
The first step towards understanding the potential impact of how this unprecedented environment might affect title insurance loss experience is understating historical trends and relationships. Let’s first look at historical trends in frequency, severity, loss costs and loss ratios. Frequency represents the average number of claims per million dollars of insurance written, which tends to be cyclical in nature. Severity is a measure of the average ultimate loss and ALAE (Allocated Loss Adjustment Expense) claim size, and it generally increases over time due to inflation. In this article, the term “loss” includes both loss and ALAE. The loss cost and loss ratio are similar, and both reflect a combination of the frequency and severity trends along with the movement and development in the real estate market and economy. Loss cost is ultimate loss per thousand dollars of insurance, while loss ratio is ultimate loss per dollar of direct written premium plus other income. Since the loss ratio is calculated based on premium, this statistic also reflects rate change information, whereas the loss cost statistic does not.
The four exhibits that follow display three lines each: one for the total industry, one for the “big four,” and one for the industry excluding big four. “Big four” is defined as any company that is a member of the four families of companies that write over one billion dollars in direct written premium annually. These four families are Old Republic, First American, Fidelity National, and Stewart. It is important to look at the big four separately from all other companies, since small to mid-size title insurance companies have historically performed differently from the big four.
Exhibit 1: Frequency by policy year
Average number of claims per $US million of insurance written
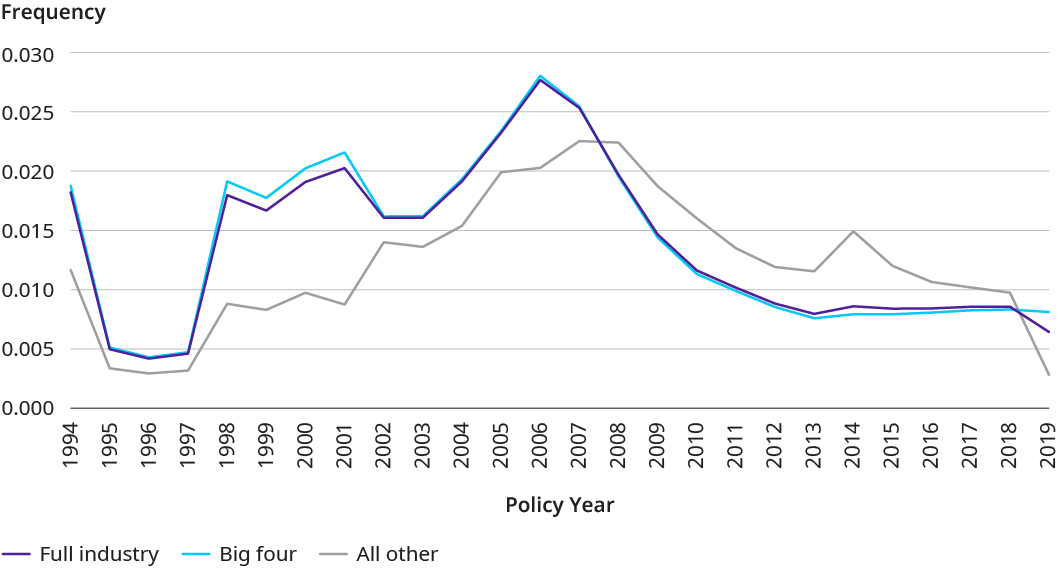
Source: Annual statement data from S&P Global Market Intelligence and Oliver Wyman’s econometric model evaluated as of December 31, 2019
Exhibit 1 displays the average number of claims per million of insurance by policy year. Prior to 2008, the all other group (all companies that are not part of the big four) had a lower frequency than the big four families. Since 2008, the reverse is true, but this could change as more information emerges. Title insurance is a long tail line of business where claims can be reported twenty or more years after the date the policy was issued. Title insurance has unique policies since there is no explicit expiration date on the policies written, and instead the insurance provides protection against claims for the length of homeownership or the length of the mortgage. Due to the long-tailed nature of these policies, the more recent years could change and eventually show the all other category with lower frequency than the big four. Even if the frequency continues to be higher for the all other category, we can see on the next exhibit that the higher frequency does not mean a higher severity for this group and in fact shows a higher reporting of smaller claims.
Exhibit 2 shows the severity for the same three groups and displays a generally increasing trend. Excluding the most recent two years, the majority of the exhibit shows the all other group has a lower average claim severity than the big four. Generally, the small to mid-size title insurers have lower severities due to fewer defalcation claims. One theory behind the fewer defalcations and lower claim severity is a greater use in writing business through affiliated agents (who tend to have lower loss ratios than unaffiliated agents and direct operations). Another theory is that smaller size companies can focus on low loss ratio states and avoid the high loss ratio states. The exhibit does show the most recent two years have a lower severity for the big four, but it is too early to tell where these policy years will ultimately end.
Does this indicate small to mid-size title insurers are initially more conservative with booking the most recent policy years reserves? Are these companies too conservative and over-reserved? Or are they adequately reserved and better prepared for future uncertainties? It is impossible to know the answers to these questions unless we look at each individual company separately to determine where that company stands relative to the industry. This is a discussion each company should have with its opining actuary in order to understand how they compare to competitors and how they may fare in the future.
Exhibit 2: Severity by policy year
Average Ultimate loss claim size, $US
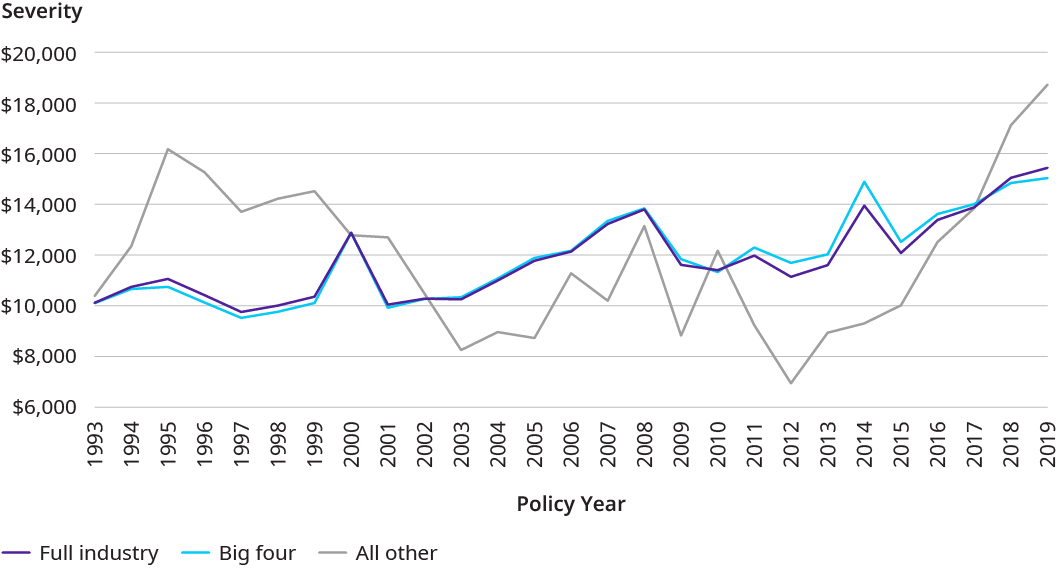
Source: Annual statement data from S&P Global Market Intelligence and Oliver Wyman’s econometric model evaluated as of December 31, 2019
Exhibit 3 displays the loss cost by policy year and reflects trends in frequency, severity and the real estate market. Exhibit 4 is very similar to Exhibit 3 except it displays loss ratios by policy year; this statistic considers the impact of rate changes. Both exhibits show the spike in losses during the housing market crash of 2008 and low losses since policy year 2010. In general, the all other group has lower loss ratios than the big four (mainly driven by the lower average claim severity previously discussed). The gap between the all other group and the big four is larger on the loss cost exhibit than the loss ratio exhibit since the loss costs do not consider rate changes or premium adequacy. A lot of the small to mid-size title insurance companies are growing and expanding into new states and therefore have larger rate changes than the big four companies. It is important to note this growth adds an extra level of uncertainty.
Exhibit 3: Loss cost by policy year
Ultimate loss per $US thousands of insurance written
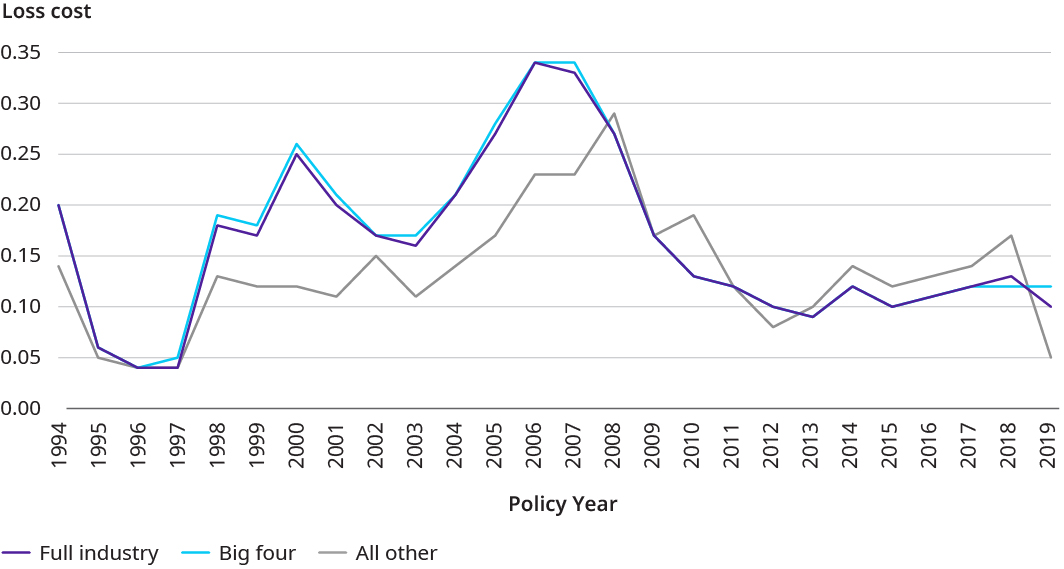
Source: Annual statement data from S&P Global Market Intelligence and Oliver Wyman’s econometric model evaluated as of December 31, 2019
Exhibit 4: Loss ratio by policy year
Ultimate loss as a percentage of $US of direct written premium plus other income
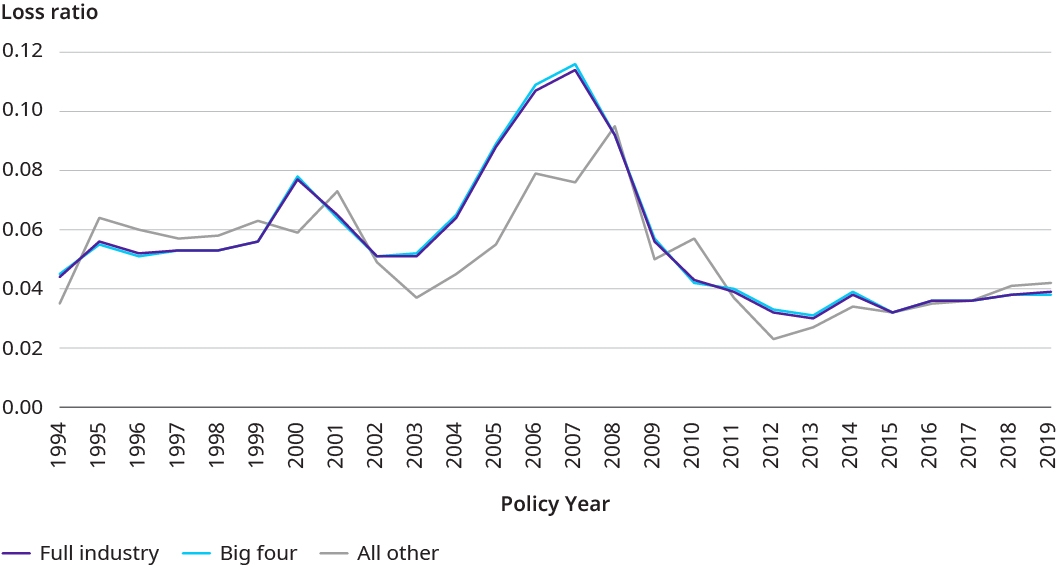
Source: Annual statement data from S&P Global Market Intelligence and Oliver Wyman’s econometric model evaluated as of December 31, 2019
So far, all the exhibits we have looked at have displayed historical industry trends. But what would happen if we look at the losses by policy year compared to an economic benchmark such as the percentage change in GDP growth? Exhibit 5 below shows a two-year lag in loss ratio by policy year compared to the percentage change in GDP growth. Historically the title insurance loss ratios have an inverse correlation with the GDP growth. Intuitively this makes sense since we would expect to see higher losses after an economic downturn.
Exhibit 5: Lagged ultimate loss ratio by year versus GDP growth percentage
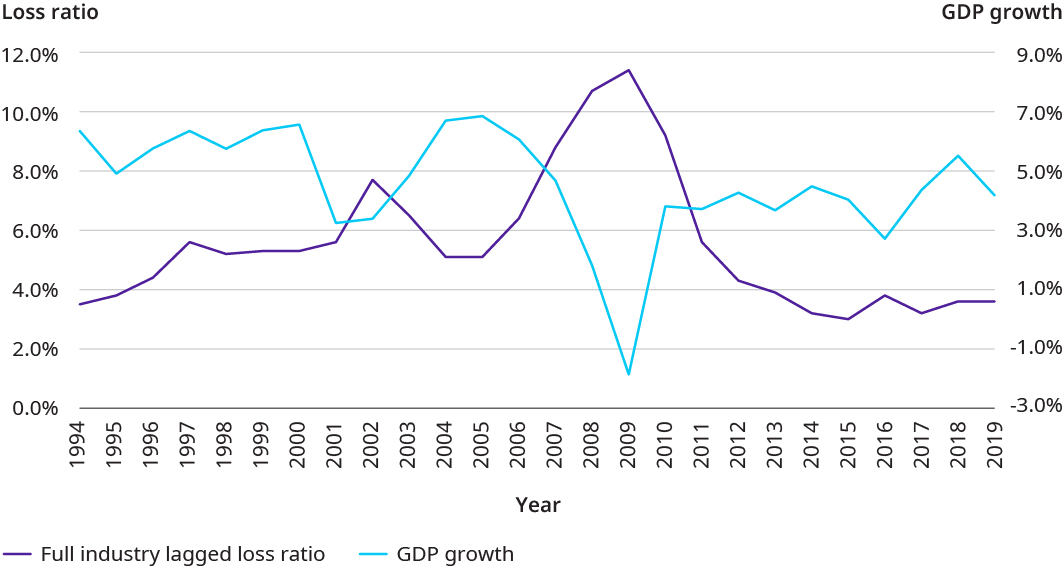
Source: Based on data from S&P Global Market Intelligence as of December 31, 2019 and data from FRED Economic Data retrieved on August 18, 2020, from https://fred.stlouisfed.org/series/GDP
Given the current state of the economy and this unprecedented pandemic, it is important to ask questions about the future of title insurance. What will happen to frequency and severity in the next few years? How will the loss ratios look for the most recent policy years as they continue to mature, and how will they look for the upcoming few policy years? What predictions can we make about title insurance over the next two years, three years or more? In order to answer these questions, we need to understand not only the current economic environment but also the real estate market.
The economy has taken a downturn since the COVID-19 crisis began. GDP growth has declined and was even negative during the first two quarters of 2020, unemployment rates have risen since March, and the Dow Jones index dipped to under 19 thousand in March for the first time in over three years. All of these influences have led to a bear market, which is no surprise given that this shortly followed the announcement of a worldwide shutdown due to COVID-19.
During this time, the real estate market also saw significant movement. The 30-year fixed mortgage rate dropped since March and even reached slightly below three percent. The number of refinance loans has increased with the low interest rates. In fact, the number of refinance originations nearly doubled the first quarter of 2020 compared to 2019 for single-family refinances. With interest rates at all-time lows during the summer of 2020, it can be assumed the percentages of loans that are refinance loans will continue to remain high in 2020. Since refinance loans are less risky in title insurance, it stands to reason the loss ratio for policy year 2020 will be low, all else being equal. But what can be expected in 2021, 2022 and later? What will happen when interest rates start to rise again and therefore refinance loans will start to decrease? Interest rates cannot be expected to remain this low forever. Even if interest rates continue to decline through 2021, they are likely to eventually turn again. It is believed that the state of the 30-year mortgage rate will depend on what happens with COVID-19 over the next year. If another shutdown occurs and COVID-19 spikes again, interest rates might continue to fall; however, if a vaccine is made public, the economy will hopefully start to recover, and interest rates will start to climb.
Eventually when rates start to rise and consequently refinance loans start to decline, title insurance losses would be expected to rise, all else being equal. Title insurers should be prepared for this change in the upcoming years and be cautious when booking their loss ratios. It is important for insurers to discuss this with their actuaries and carefully track the economic and real estate factors that closely impact title insurance losses.
Referring to Exhibit 5 which displays the lagged loss ratios compared to the percentage growth in GDP, we can make predictions about the loss ratio for policy year 2018, which is the year that will line up with the 2020 GDP growth based on the two-year lag. If history repeats itself, this would indicate the policy year 2018 loss ratio will increase from the current booking (industry average booked loss ratio for 2018 as of December 31, 2019 is 3.8 percent). If we added the GDP growth for 2020 during the first two quarters to Exhibit 5, we would see a point of approximately negative 4.4 percent. This would indicate a high title loss ratio for policy year 2018, well above the current industry booked loss ratio of 3.8 percent. Of course, history may not repeat itself, and there are other factors to consider such as the stock market rebounding and even reaching close to the record high we had previously seen before the pandemic. The changes to the economy in 2020 are like nothing we have ever experienced in the past. This could lead to changes in the relatively consistent historical relationship between the economy and title insurance losses (seen in Exhibit 5). No matter what happens in the future, it is imperative that title insurers and their actuaries are cautious and continue to watch economic and real estate trends as we get close to year-end 2020 and select new indicated and carried reserves.
Many people are eagerly waiting for 2021 to begin in hopes of a brighter future. 2020 has been a year for the history books and the events of this year will have lasting impacts in the future. While we are all enthusiastic to ring in the new year, we must be cautious about the long-term effects of the pandemic on the economy. Title insurance companies must be aware of both economic and real estate trends during these uncertain times and understand how these indices have impacted frequency, severity and losses historically in order to make educated decisions about the future.
###
