We present the June 2022 edition of our health insurer financial newsletter, renamed Pulse! Earlier in the year, we released Part 1 of our newsletter previously named Health Insurer Financial Insights which included large public companies’ Q4 2021 financial performance and earnings highlights.
The complete Pulse Volume 8 includes reported statutory claims experience for health insurers through Q4 2021, MLR Rebate trends, Part 1 highlights from public companies’ 2021 financial statements, and a summary of recent health plan M&A activity and valuation trends, and we highlight the information not included in Part 1 below.
Our aim is to keep you abreast of key market trends and dynamics that impact health insurer financial results and profitability. We hope you enjoy the newsletter and find it informative.
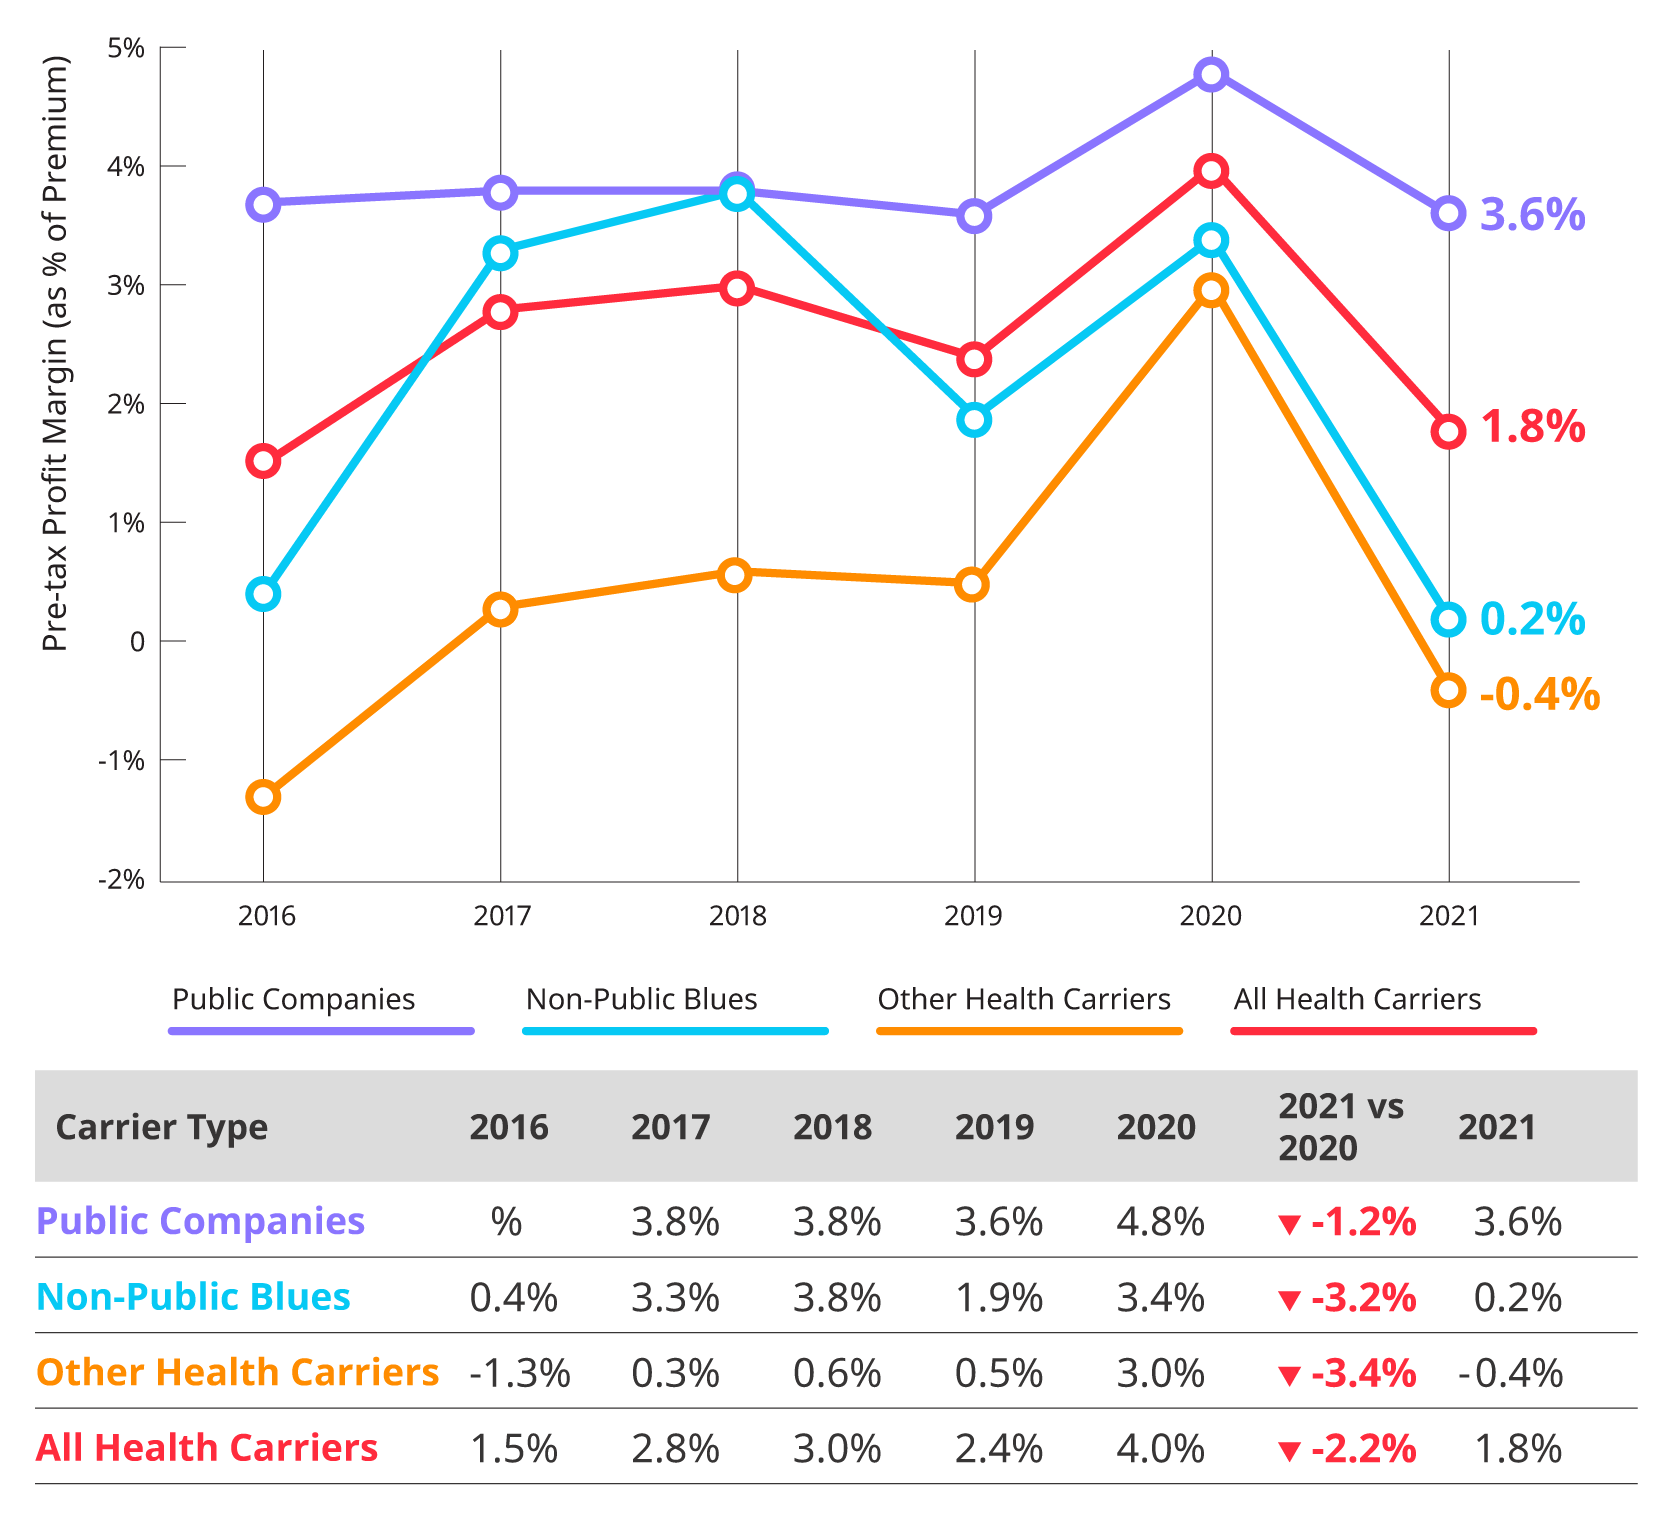
Q4 2021 Statutory Financials – Individual, Group, Medicare, and Medicaid Markets
Overall, pre-tax margins decreased from 4.0% in 2020 to 1.8% in 2021 due to increased loss ratios and utilization.
2017 to 2021 Reported Claims Experience and Trends
The reported Q4 2021 trends ranged from 2.4% (Medicare Advantage) to 16.0% (Individual), the reported full-year 2021 trends ranged from 0.4% (Medicaid) to 17.5% (Dental) reflecting the impact of pausing redetermination requirements for Medicaid, and the larger impact COVID had in 2020 on the utilization of Dental services compared to other lines of business.
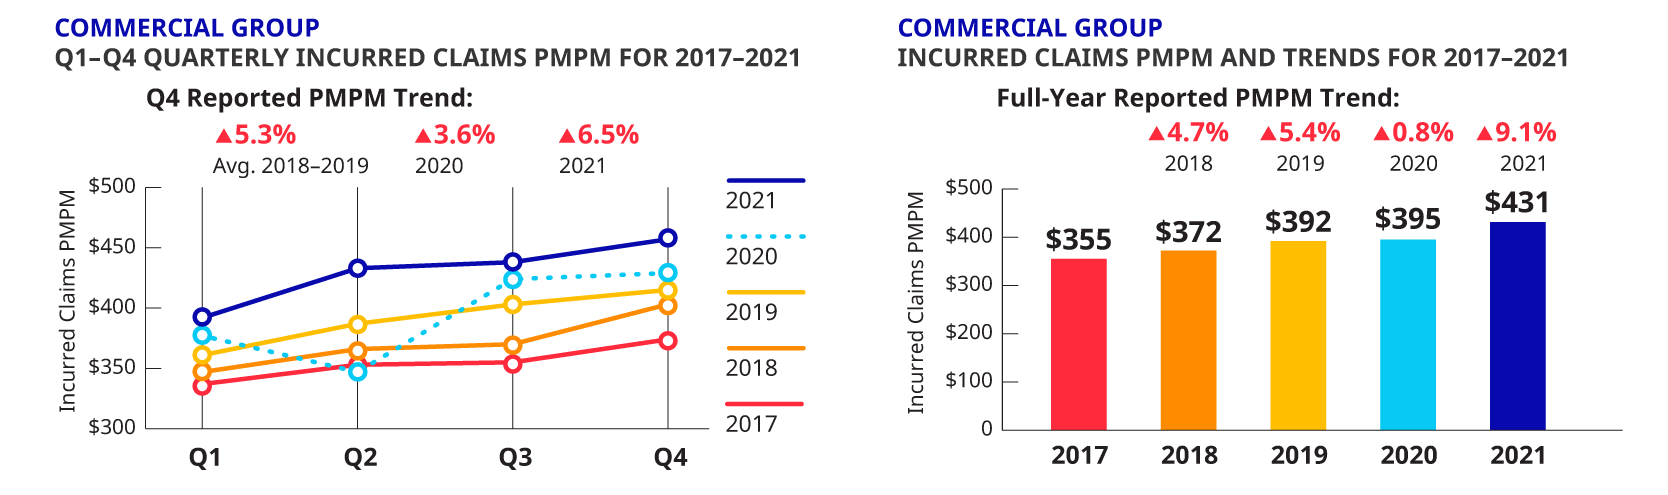
Group Market Claims Experience
The reported Q4 2021 claims PMPM ($457) increased by 6.5% from Q4 2020 claims PMPM ($429), which is slightly higher than the 5.3% average trend for Q4 2018 and 2019. For full-year 2021, the reported claims increased by 9.1% from 2020, reflecting a significant increase in costs and trends from 2020 when costs were depressed by COVID.
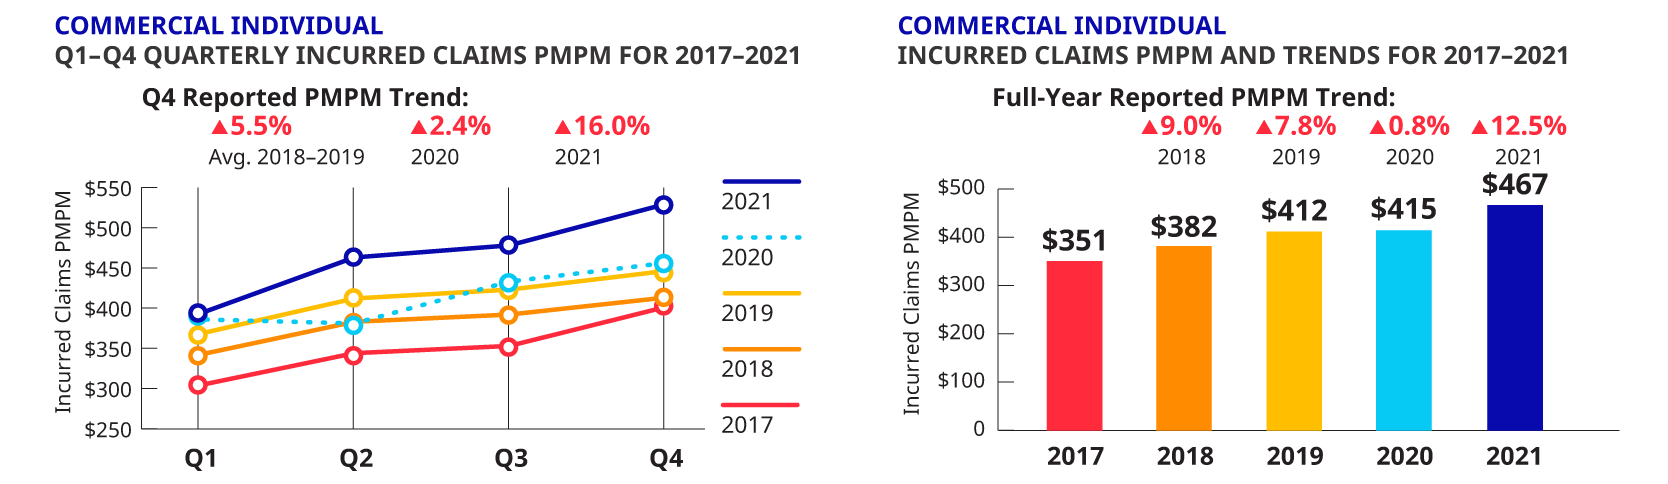
Individual Market Claims Experience
The reported Q4 2021 claims PMPM ($529) increased by 16.0% from the Q4 2020 claims PMPM ($456), which is a significant increase compared to the 5.5% average trend for Q4 2018 and 2019. For full-year 2021, the reported claims increased by 12.5% from 2020, reflecting a significant increase in costs and trends from 2020 when costs were depressed by COVID.
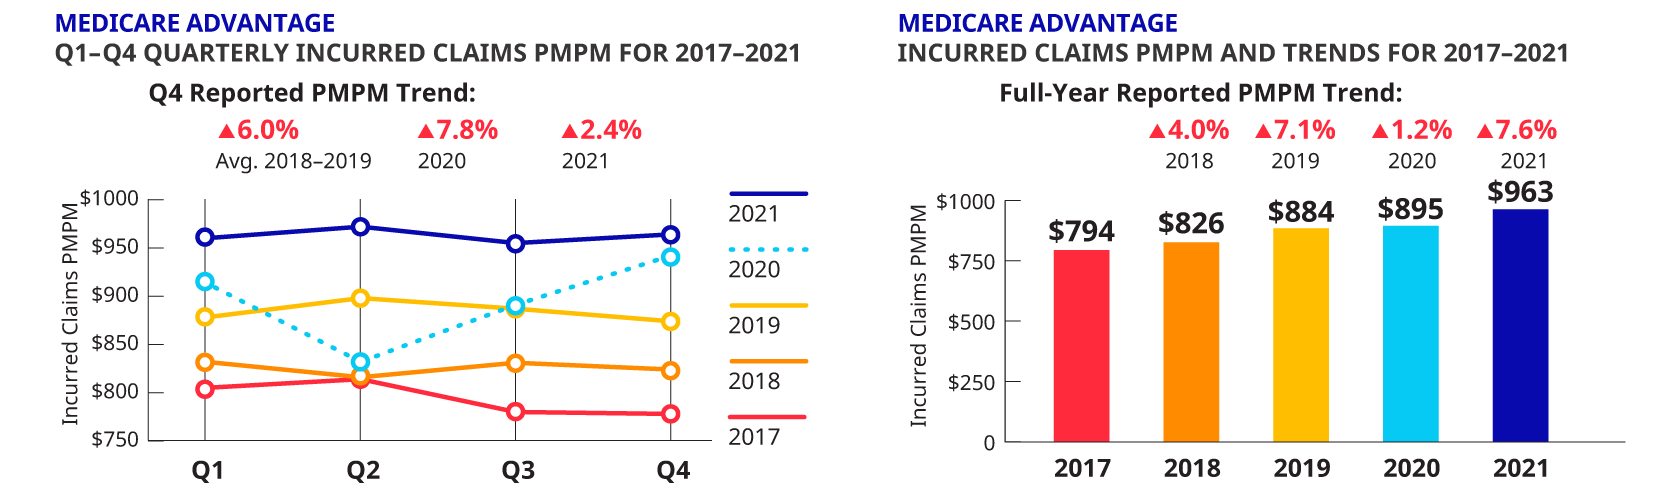
Medicare Advantage Market Claims Experience
The Q4 2021 increase in the Medicare Advantage market incurred claims PMPM from Q4 2020 was 2.4%, lower than historical average increase of 6.0% average trend for Q4 2018 and 2019. For full-year 2021, the reported claims increased by 7.6% from 2020, reflecting a significant increase in costs and trends from 2020 when costs were depressed by COVID.
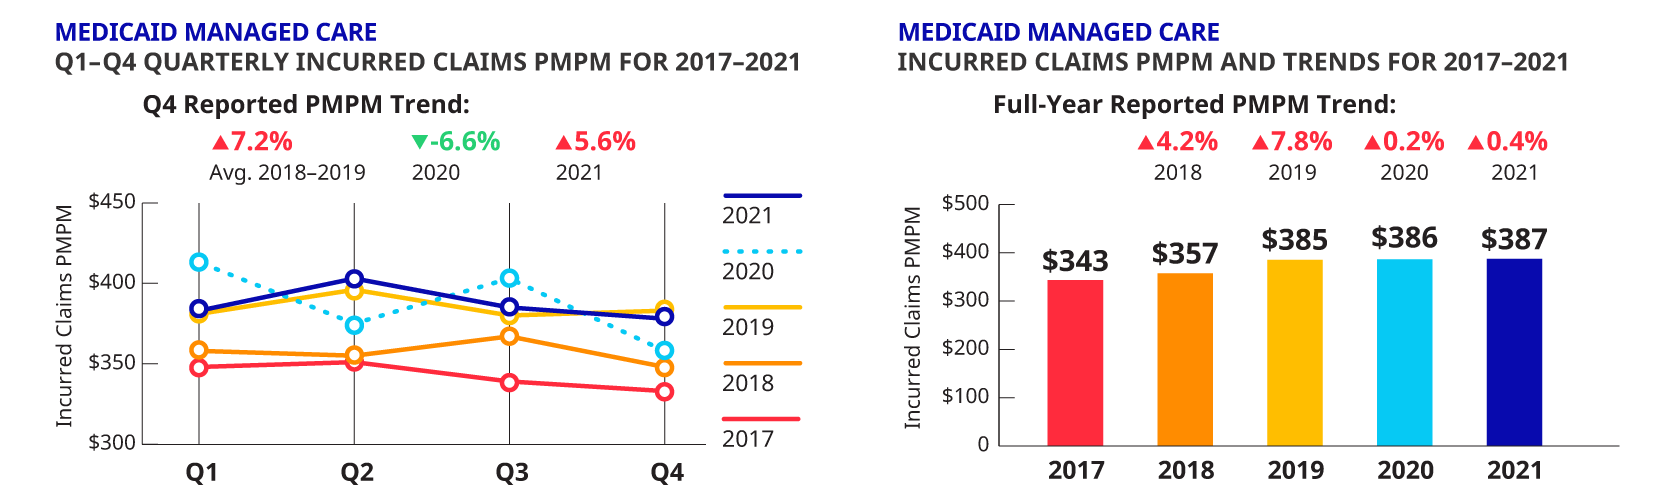
Medicaid Managed Care Market Claims Experience
Reported claims PMPM in Q4 2021 increased by 5.6% from Q4 2020 which is lower than the 7.2% average trend for Q4 2018 and 2019. For full-year 2021, the reported claims remain flat with a 0.4% increase from 2020. Claims PMPM in 2021 was $387 almost unchanged from 2019 ($385) and 2020 ($386).
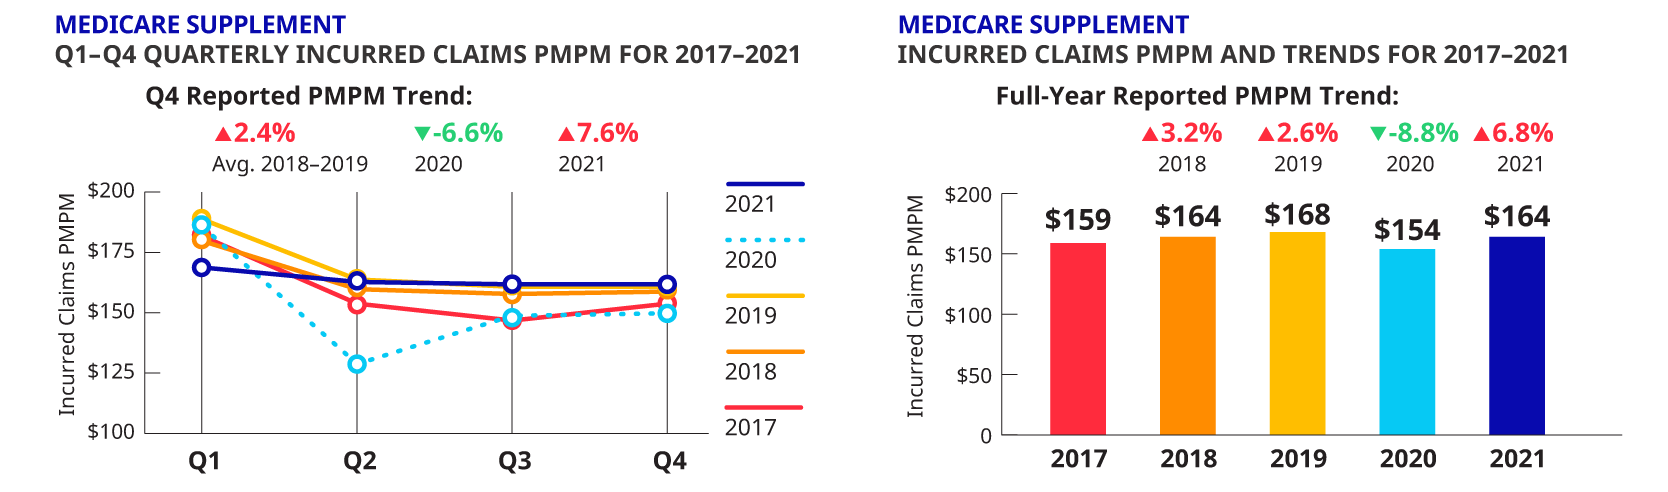
Medicare Supplement Market Claims Experience
Claims in Q4 2021 increased by 7.6% from Q4 2020 which is higher than the 2.4% average trend for Q4 2018 and 2019. For full-year 2021, the reported claims increased by 6.8% from 2020. Claims PMPM in 2021 of $164 were similar to those in 2019 ($168).
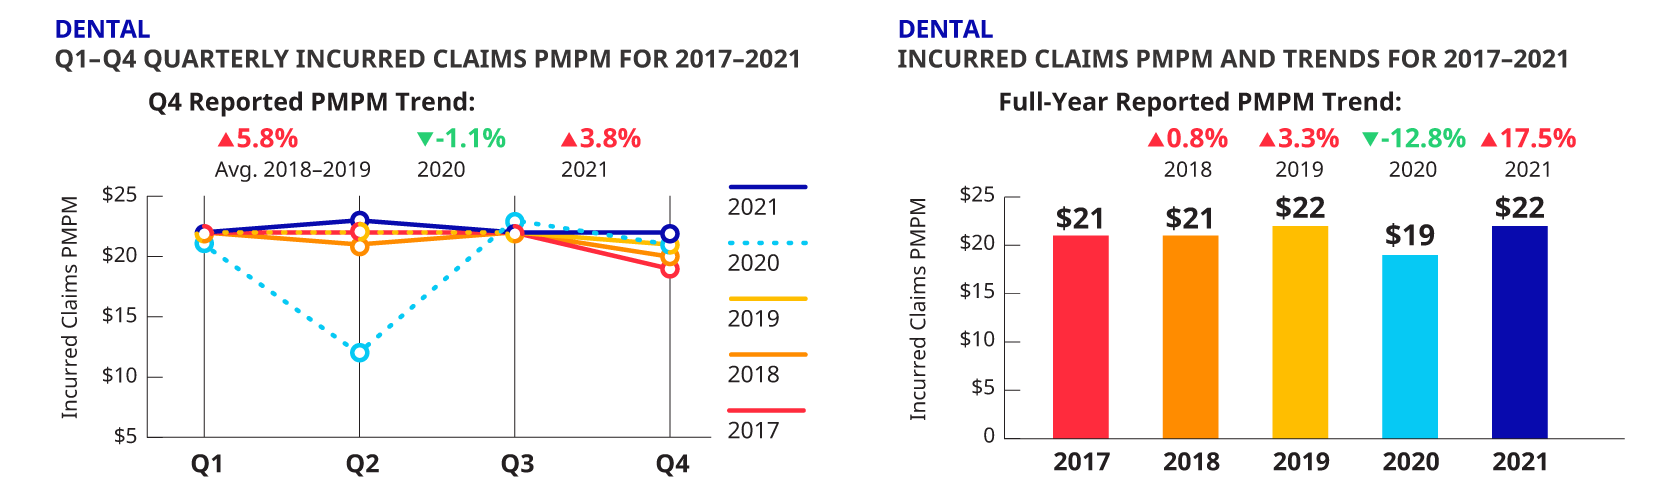
Dental Market Claims Experience
Claims costs in Q4 2021 of $22 PMPM were in line with the 2018–2019 pre-COVID experience (average of $21 PMPM) following the decrease in utilization and costs seen in 2020.
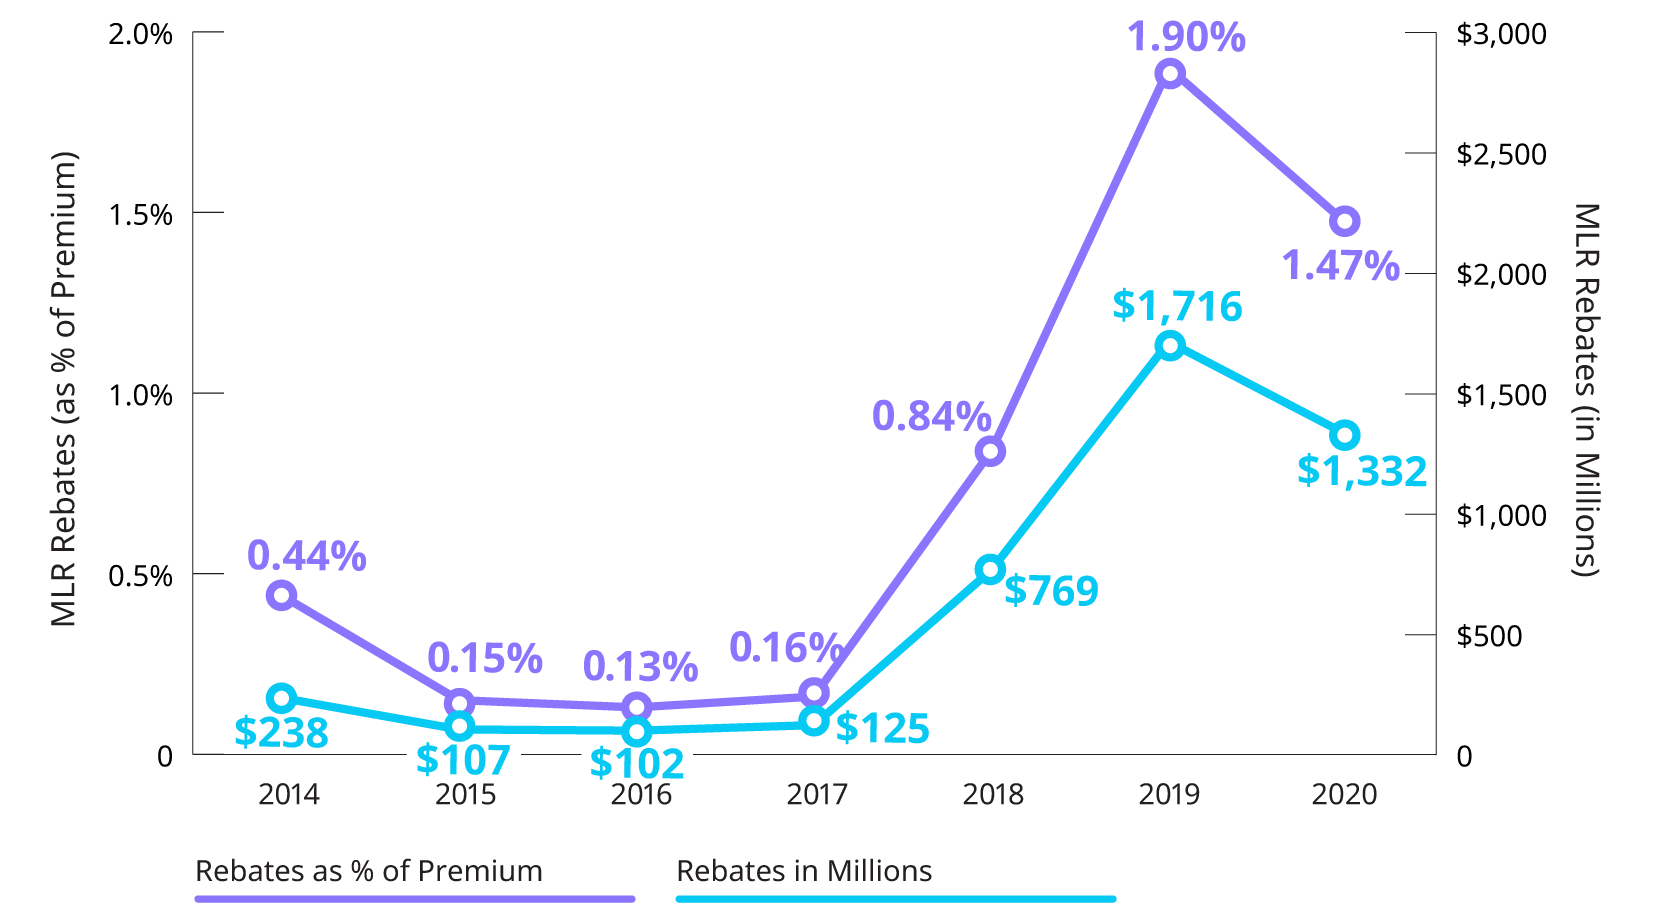
Individual Market: MLR Rebate Trends
The Three-Year Average MLR did not change substantially in 2020, going from 82.3% as of year-end 2019 to 81.9% as of year-end 2020. MLR rebates decreased from $1.7 billion payable in 2020 to $1.3 billion or about 1.5% of premium payable in 2021. In 2020, with lower claims experienced due to COVID-19, health plans also reported lower premiums and higher offsetting quality improvement expenses and taxes, which increased the annual MLR from 81.7% in 2019 to 85.2% in 2020.
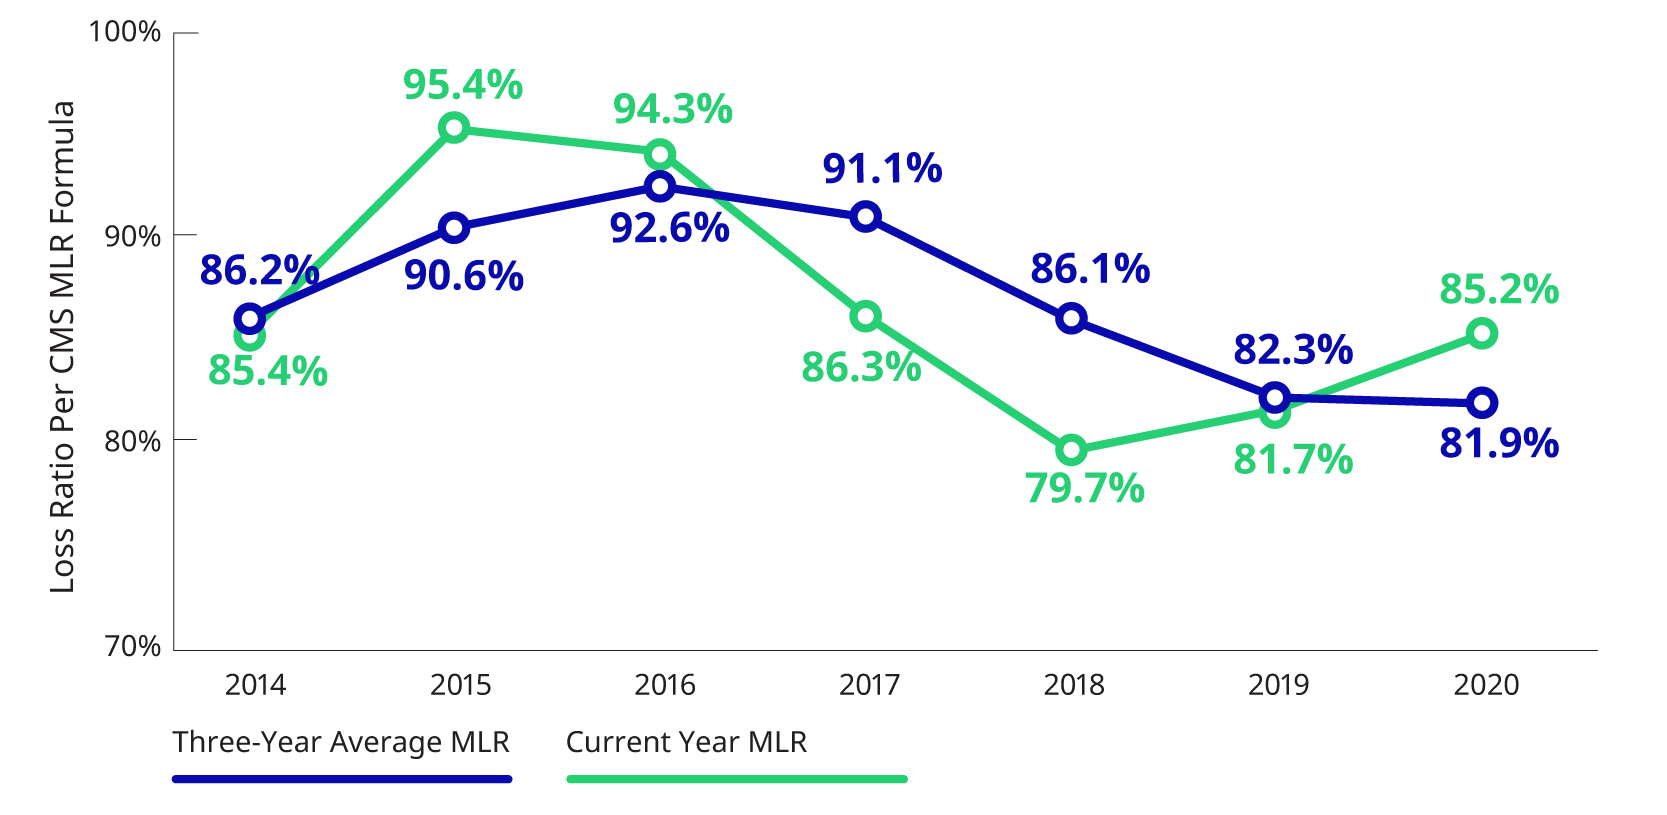
The chart following shows historical MLR rebates as a percentage of premiums and dollar amounts from 2014 to 2020.
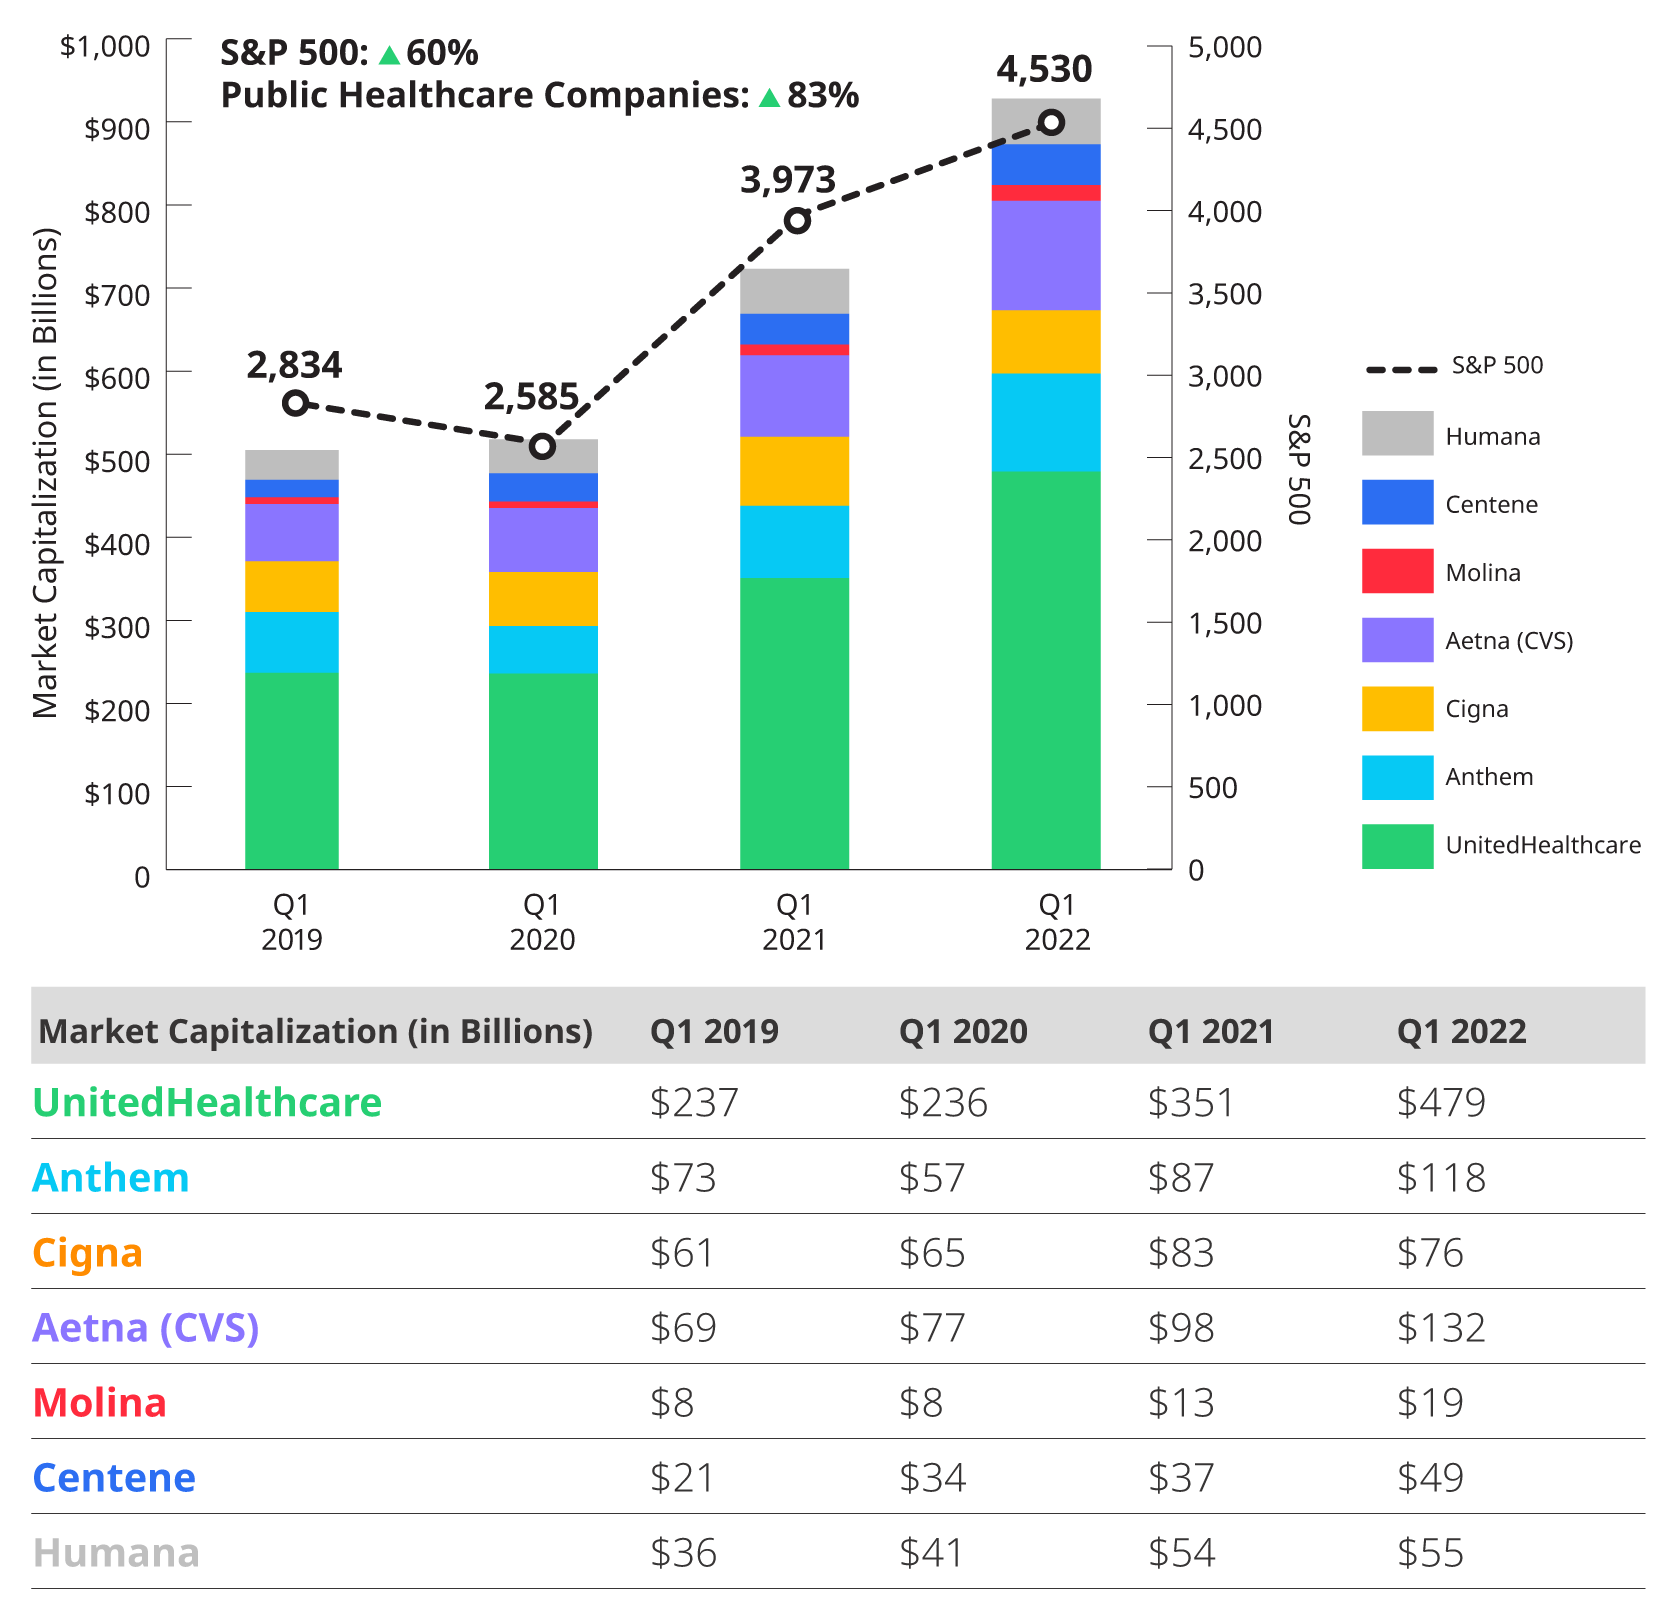
Market Capitalization Trends of Health Plans through Q1 2022
Public healthcare companies have increased their market capitalization significantly: by 83% from Q1 2019 to Q1 2022 outperforming the S&P 500 index growth of 60% during the same time period. Centene’s and Molina’s capitalization more than doubled (120% and 124% increase respectively) which is at least partially due to their acquisitions of WellCare and Magellan, respectively. UnitedHealthcare (102%) saw similar growth in its market capitalization.
Download our full report to read more.
