Securing Your Part D Position in a Fierce MA Market

Over 24 million Americans are enrolled in Medicare Advantage (MA) plans today. Consumers are increasingly turning to MA products due to their rich benefits, low premiums, innovative offerings, and high-quality networks. By 2030, 20 percent of the US population will be over 65 years old, and enrollment in MA plans amongst Medicare-eligible individuals is expected to rise to 51 percent. As the MA market has grown, so too has Part D enrollment – including Medicare Advantage Prescription Drug plans (MAPD) and standalone Prescription Drug Plans (PDP) – which has increased at a Compound Annual Growth Rate of five percent since the program began in 2006. In fact, nearly 90 percent of total MA enrollment in 2020 was in a plan with Part D coverage.
An aging population coupled with a growing drug segment make Part D an attractive market. However, the market is highly consolidated and full of competition. Competitive pressure is further compounded by regulatory complexity and changes, including potential updates to the U.S. Department of Health and Human Services’ (HHS) regulations that eliminate manufacturer rebates and, if implemented in 2023+, will likely increase Part D plan liability (partially, but likely not fully, offset by an increase in direct subsidy). Thus, uncertainty looms in the near term for Part D.
Strategies Today to Leverage Opportunities Tomorrow
In light of market dynamics and with the 2022 bid season kicking off, how can you successfully tap into this market opportunity? There are certainly nuanced differences between MAPD and standalone PDP strategies. For example, an MAPD plan may choose to lose money on the drug side if it means material upside on the medical side – within Centers for Medicare & Medicaid Services (CMS) limits, of course. However, regardless of product type, there are some common themes around traversing the drug benefit. Intelligently positioning your products in terms of formulary and product design is a good place to start.
To Outperform Your Competition, Maintain a Balanced Approach, or Know Why You Are Not
While most small to medium health plans (such as those who have been in the market fewer than five years and/or have fewer than 100,000 members) often adopt the Standard Formulary from their Pharmacy Benefit Manager (PBM), the big players tend to design their own custom formulary. Many of these health plans up-tier year over year to balance cost pressures, while managing rebate structure and clinical strategy. Additionally, if plans make formulary decisions without close consideration and evaluation of the competitive landscape, they may inadvertently design a formulary that is significantly richer or leaner than what competitors offer. This means a potential downstream impact on growth and/or sustainability may follow.
Oliver Wyman’s competitive formulary analysis compares the overlap in spend by tier for hypothetical Plan A versus competitors to determine if this is the case:

In the scenario above, our competitive review reveals Plan A is richer than its competition based on overlap in spend by tier, but it is still unclear if this is a desirable position.
Key questions to ask to ensure you’re on the right track include the following:
Q: Is my plan attracting members with more significant health needs than it was designed for?
If the answer to this is yes, your plan may want to strategically move to a leaner formulary. In addition to up-tiering or removal of drugs, plans can also apply Utilization Management levers (for example, prior authorization, quantity limits, and step therapy). But this must be done with careful consideration for both the Consumer Assessment of Healthcare Providers (CAHPS) and clinical strategy.
Q: Is a richer formulary always the best approach if my objective is to grow and maximize enrollment?
Not necessarily. More important than growth is “sustainable growth.” A rich plan must pull on all their levers (such as risk adjustment, STARs, administrative cost efficiency, and the like) to hit target margins and justify its price point. Otherwise, the plan may need to reclaim its benefits in future years, leading to member confusion around costs, which often drives members to change plans. A thorough evaluation of plan financials/bid strategy must be completed to ensure you can support a rich design, even if growth is your primary objective.
Thoughtful formulary design is particularly relevant in light of HHS’ recent decision to eliminate manufacturers’ rebates in Part D, now effective Jan 1, 2023. While there is a chance this ruling could be overturned, or further delayed, by the new Biden administration or through potential litigation from PBMs and manufacturers, if the ruling stands, plans will require an update to contracting and a new approach to formulary design for CY2023. Plans should be starting discussions now to determine their strategy.
Product Design Considerations
In 2020, over 3,000 individual plans were offered, with 93 percent of MA beneficiaries enrolled in a MA Part D plans with a $0 premium and 81 percent of MA enrollees in a plan rated four-Stars or above. Choosing the right plan isn’t easy, nor is it simple to unpack what draws a consumer to one plan over the next. That said, the drug benefit is more shoppable than other elements of the MA market. Every year consumers can estimate out-of-pocket costs (OOPC) independently through Medicare Plan Finder, in coordination with a sales agent or broker, or evaluate plan options directly on health plans’ websites.
In addition to more traditional product design approaches, Oliver Wyman seeks to better understand consumer behavior by analyzing Medicare Plan Finder searches as illustrated in the drug basket analysis below. The OOPC estimate represents the intersection of all product design components: benefits and premium, formulary, and utilization management. These components are each critical as a health plan strategically designs a Part D product to attract their target population.
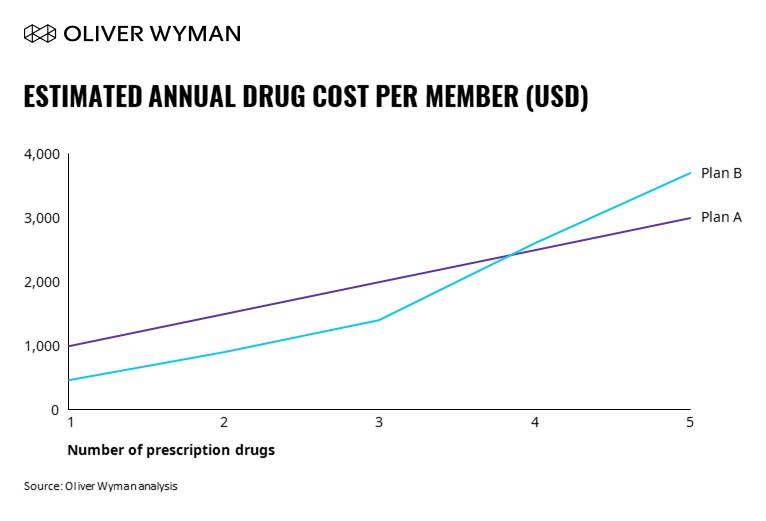
According to the above chart, although Plan B is the least expensive for low utilizers (only on one to two drugs), the OOPC escalates quickly if consumers take three or more drugs. This is likely the most ideal OOPC curve for low-cost/lean plans that are the best fit for lower utilizers.
Following product design, health plans should consider a drug basket analysis to assess the OOPC for varied consumers and to ultimately validate the design.
What You Need to Know
With bid season nearly upon us, every payer’s pharmacy team should be thinking through how they can position themselves competitively amidst evolving headwinds and tailwinds.
As next steps, ask yourself these three questions (or perhaps add them to your next team agenda) regarding your organization’s future trajectory:
Q: Is your drug plan design attracting the members you want?
Q: Is your formulary competitive or is it too lean/rich?
Q: Do you have a clear strategy for your drug plan given your MAPD product positioning?
Answering these questions will better set your health plans up for sustainable growth. The sweet spot between market analysis and design know-how will help get you there. Grow, yes. Generate revenue, yes. However, the balancing act between them to ensure you are growing sustainably is truly the most important part. Designing an action plan around insights like these is the basis of tapping into a competitive Part D market. The time is now to get started on the right foot.