The transportation, shipping, retail, and finance industries have made strides in the digital transformation of today’s world, with many of their innovations paving the way for deriving data-driven strategies using big data tools. However, healthcare has been slow to adapt. Challenges unique to the healthcare industry make real-time data-driven strategies difficult to execute. Some of the problems with its data and processes include a lack of robust standardization, classification, and coordination, as well as its need for significant and highly specialized domain knowledge. It is also difficult to get both clinical and administrative data in a timely way. Payment policies are notoriously difficult to understand. Finally, there are practice pattern variations across regions and provider systems.
A new approach for standardization, enrichment, and visualization
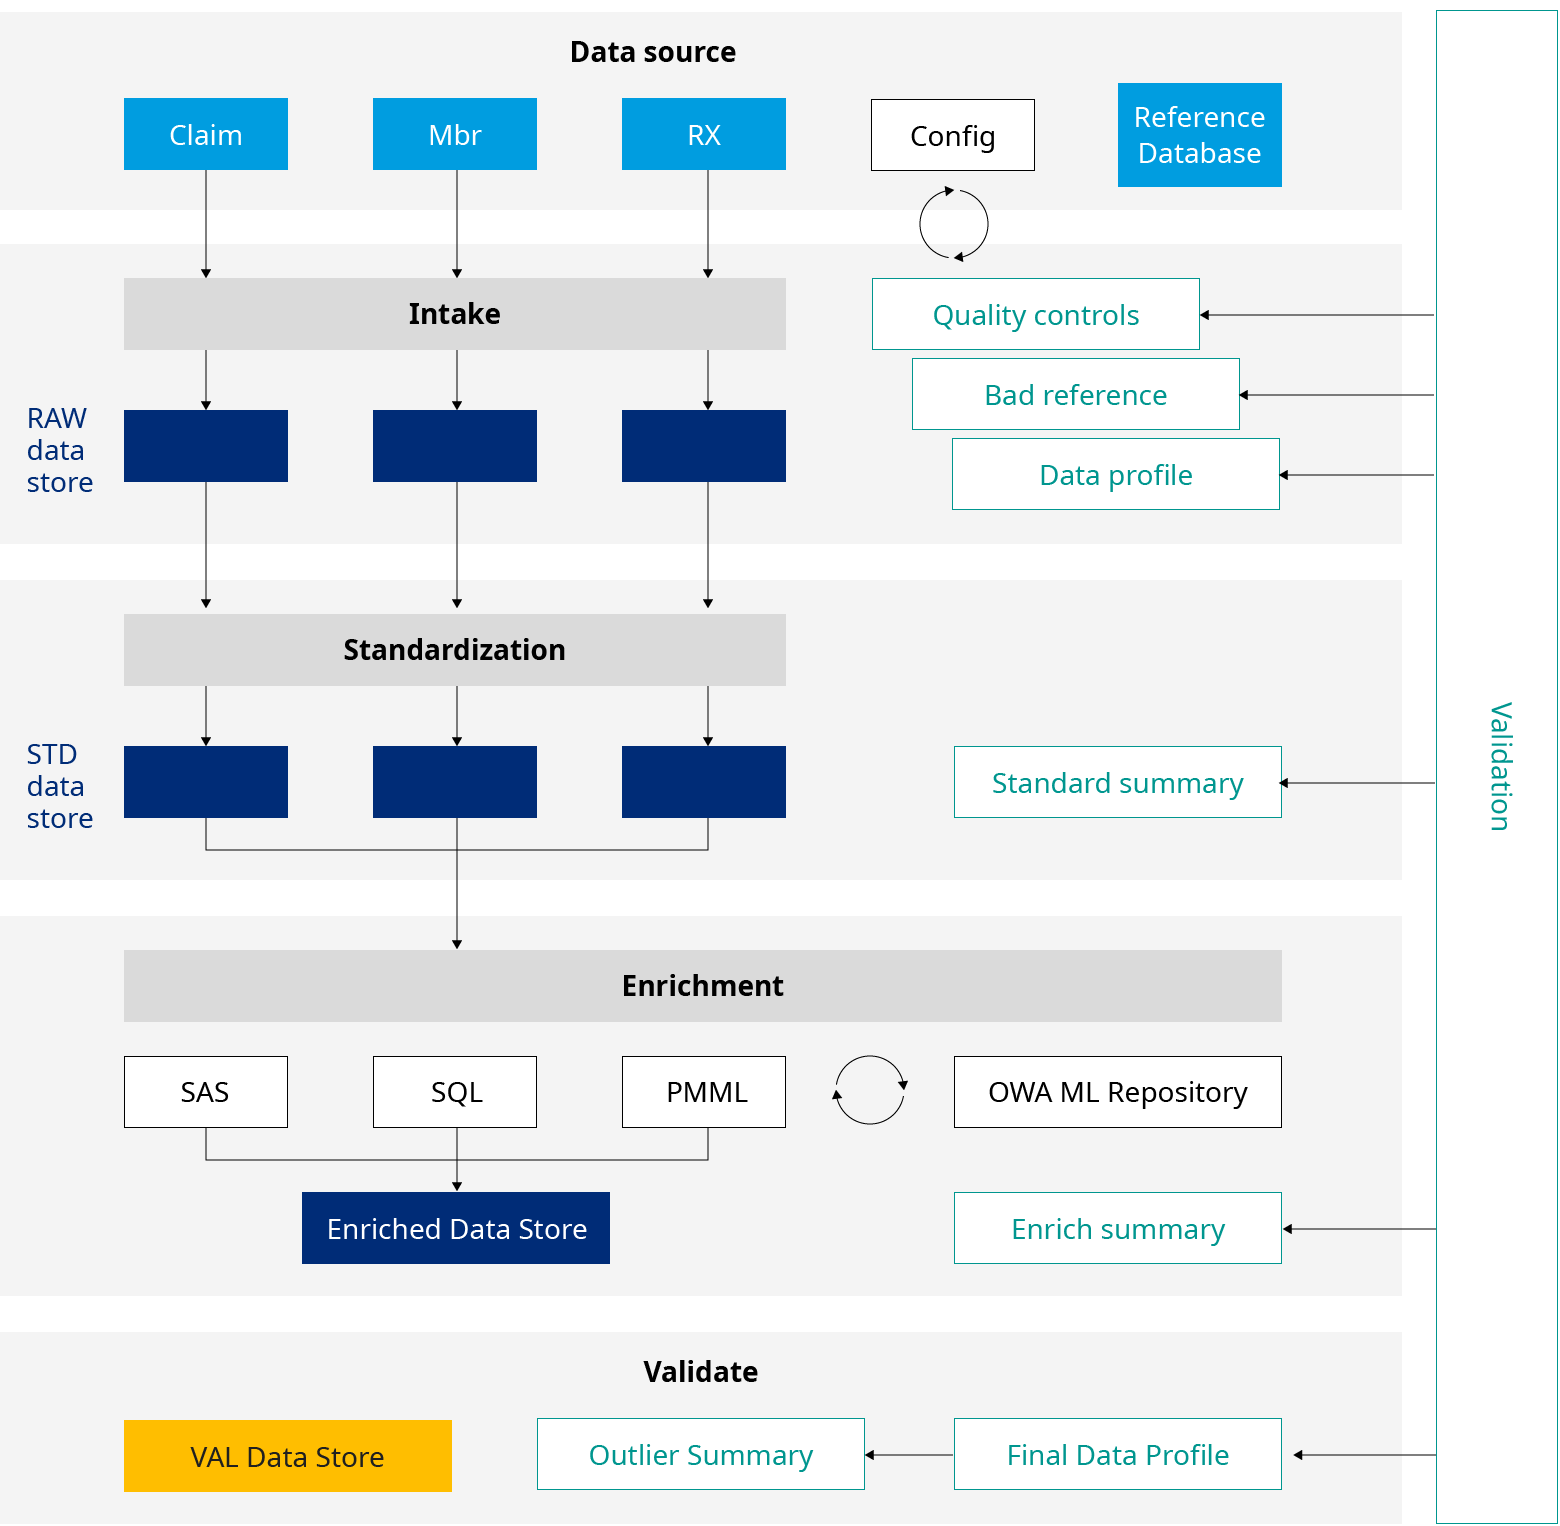
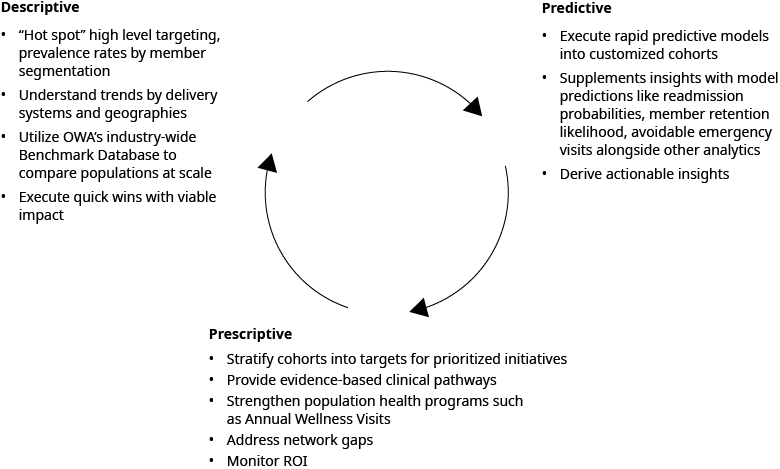
At Oliver Wyman, we have a better approach. Our Actuarial Predictive Insights team has developed the Rapid Analytics Assessment (RAA) module to streamline, standardize, transform, and enrich healthcare data. Along with the transactional data, the module uses Social Determinants of Health (SDoH) indicators, proprietary episodic groupers, and clinical segmentation based on current research. A robust nationwide data lakehouse of Commercial (including ACA Individual and Small Group) and Medicare populations generates industry benchmarks and trend analytics. Additionally, Oliver Wyman applies best practice data science techniques and actuarial expertise within the RAA module. Applying machine learning predictions, such as readmission probabilities, high-cost claimant categorization, member retention likelihood, and risk scores, provides the insights only available through predictive analytics.
Expanded data visualization provides better results
We complete the RAA module with effective data visualization tools for clients. Multiple views in revenue, risk, financial, clinical, and enrollment domains are available, which informs actionable, data-driven strategies to effectively manage population health.
Member level analytics help make program management more effective
By producing member level and cohort level views in days rather than weeks or months, RAA provides health systems with actionable insights in a timely way to manage their population. By incorporating SDoH and episodic groupers, RAA’s visualization tool helps providers in finding areas of improvement in their clinical programs to manage their patients more effectively. This can be leveraged in their value-based contracts. It also enables payers to find and close gaps in their operations, network, and benefit design, which are essential for effective population health management and better financial results.
A digital transformation that unlocks insights for strategic resource allocation
The RAA module performs rapid assessment of clients’ transactional dataset to “hot spot” key drivers of suboptimal financial performance, clinical and non-clinical gaps in population health management, and quantify opportunities for improvement in patient care and financial performance. Within days of receiving the data, it generates an opportunity heatmap with highest impact initiatives that will help prioritize allocation of resources for both payer and providers.
The digital transformation of today’s business environment will continue to improve many sectors and find novel solutions to old and emerging problems. With the RAA module, Oliver Wyman is moving forward in this transformation and making relevant, meaningful, data-driven solutions easier for healthcare clients to obtain.