The American Rescue Plan Act (ARPA) has made health insurance coverage in the Affordable Care Act’s (ACA) individual marketplaces considerably more affordable for millions of Americans, but only for 2021 and 2022. In this white paper, we present estimates of the impact on health coverage if the ARPA changes to the advance premium tax credits (APTCs), described below, are made permanent.
Background
Under the ACA, individuals can receive APTCs to help them afford health insurance. The APTC is the difference between two amounts:
- The second lowest-cost silver plan in the market (the benchmark plan), and
- The percentage of an individual’s or family’s income (their applicable percentage) that they must to pay towards the cost of their benchmark plan.
In this way, individuals and families pay the applicable percentage of their income for the benchmark plan, and the APTC makes up the difference between what the individual or family pays and the full cost of the benchmark plan.
Under the ACA prior to ARPA, APTCs were not available for households with incomes above 400% of the federal poverty level (FPL), so these households had to pay the full cost of Marketplace coverage. In 2021, the average premium for the benchmark plan for a 50-year-old in the Healthcare.gov states is roughly $7,800, or about 15% of income for an individual with an income at 400% of FPL.
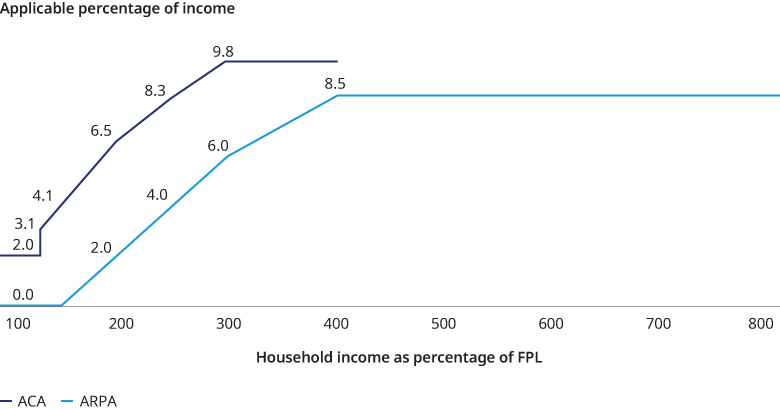
As we show in Figure 1, for 2021 and 2022, ARPA has made purchasing coverage much more affordable at all income levels. Under ARPA, coverage is available for $0 premium up to 150% of FPL. ARPA reduced the applicable percentage by 69% at 200% of FPL and by 14% at 400% of FPL. Importantly, ARPA extended the availability of APTCs to all income levels above 400% of FPL with the applicable percentage set to 8.5%.
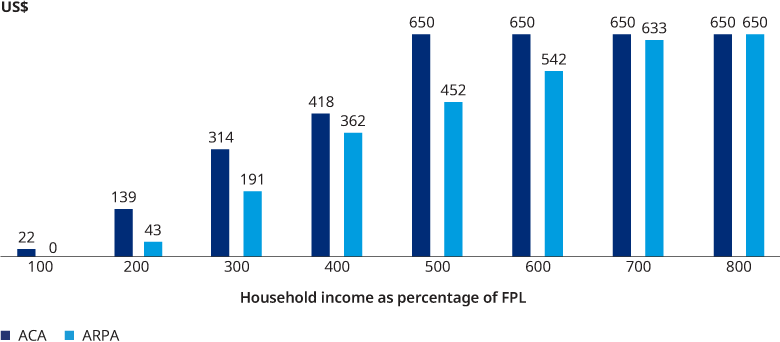
In Figure 2, we show how the applicable percentages in Figure 1 translate to net monthly premium costs for a 50-year-old and a benchmark plan with an annual premium of $7,800. Under ARPA, net premiums are $0 up through 150% of FPL, and lower up to 800% of FPL, with the difference between the ACA and ARPA premiums decreasing through 400% of FPL. Figure 2 also illustrates the end of the “subsidy cliff” above 400% FPL. Where under the ACA households with income above 400% FPL had to pay the full cost of coverage, under ARPA, no household is required to pay more than 8.5% of their income towards the cost of the benchmark plan.
HHS is reporting that more than 2.5 million individuals have signed up for coverage in the Healthcare.gov state-based Marketplaces during the special enrollment period that allows individuals to take advantage of the ARPA APTCs. We note that CBO estimated that ARPA would result in 1.7 million new marketplace enrollments in 2022 including the assumption that the ARPA subsides would not be available beyond 2022.
Modeling the Impact of ARPA APTCs Being Made Permanent and Medicaid Expansion
We used our Health Reform Microsimulation Model (HRM Model) to make estimates of the impact of the ARPA subsidies being made permanent, with a focus on the changes ARPA made to the APTCs and Medicaid expansion.
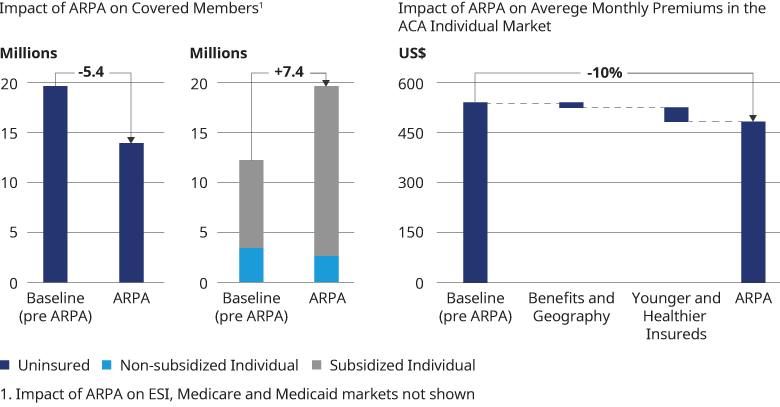
In Figure 3, we show our HRM model estimates of how the markets would change if the ARPA APTCs were made permanent and the full effects of the ARPA APTCs were incorporated into the market in 2021. In reality, we expect that it would take several years for the full effects of ARPA being made permanent to be reflected in the health insurance markets. We estimate that the number of people covered under the individual ACA market would increase by 7.4 million, primarily among those eligible for APTCs (subsidized enrollees) due to the end of the subsidy cliff and more generous APTCs below 400% of FPL. We estimate that the number of uninsured would decline by 5.6 million. This estimate assumes that 1.5 million previously uninsured would be covered through Medicaid expansion and 4.1 million would be covered due to ARPA APTCs being more generous and made permanent in the individual ACA market. We assumed that Medicaid expansion would occur in the non-expansion states with 50% probability such that in our model, half of the individuals living in non-expansion states with income below 138% of FPL would become newly eligible for Medicaid. We also estimate that the average premium, before APTCs, in the individual ACA market would decline by 10%, from $556 per insured per month to $501, due primarily to a younger, healthier risk pool, assuming that the impact of the expansion in coverage was fully realized in 2021.
As evidenced by the 2.5 million people taking advantage of the current special enrollment period, ARPA has already had a significant impact on coverage choices and the size of the individual market, and presumably the number of uninsured. Our modeling shows that making the ARPA APTCs permanent, coupled with Medicaid expansion, would result in a further reduction in the number of uninsured.
Qualifications, assumptions, and limiting conditions
There are no third-party beneficiaries with respect to this report, and Oliver Wyman does not accept any liability to any third party. Information furnished by others, upon which all or portions of this report are based, is believed to be reliable, but has not been independently verified, unless otherwise expressly indicated. Public information and industry and statistical data are from sources we deem to be reliable; however, we make no representation as to the accuracy or completeness of such information. The findings contained in this report may contain predictions based on current data and historical trends. Any such predictions are subject to inherent risks and uncertainties. Oliver Wyman accepts no responsibility for actual results or future events. The opinions expressed in this report are valid only for the purpose stated herein and as of the date of this report. No obligation is assumed to revise this report to reflect changes, events, or conditions, which occur subsequent to the date hereof. All decisions in connection with the implementation or use of advice or recommendations contained in this report are the sole responsibility of the client. This report does not represent investment advice nor does it provide an opinion regarding the fairness of any transaction to any and all parties. In addition, this report does not represent legal, medical, accounting, safety or other specialized advice. For any such advice, Oliver Wyman recommends seeking and obtaining advice from a qualified professional. Our modeling work was prepared on behalf of the Blue Cross Blue Shield Association. The authors of this report are members of the American Academy of Actuaries and meet that body’s qualification standards for performing this work.
