After two decades of double-digit growth, what is the impact of e-commerce on the retail industry and the wider environment? This question is particularly important after 2020, a year dominated by the COVID-19 crisis, in which e-commerce played a critical role while many stores were closed.
In 2019, e-commerce reached 11 percent of total retail sales in the eight European countries we studied for this report (France, Germany, Italy, the Netherlands, Poland, Spain, Sweden, and the United Kingdom). Initial indications are that e-commerce grew by 31 percent from 2019 to 2020, following growth of 12 percent from 2018 to 2019. Data for 2020 and the following few years will be blurred by the effects of the COVID-19 crisis.
This report aims to provide information and long-term perspectives for stakeholders as they make decisions that will shape the future of retail. Regulators need to decide what would be the best frameworks to govern retail in the future. Businesses are constantly assessing which channels and geographies to expand into, and physical stores are adding online services that let them function as omnichannel retailers. Consumers increasingly understand that their choices influence the future of their neighborhoods and of the wider environment. To help these actors, the report focuses on two main areas affected by the growth of e-commerce: the evolution of retail and environmental impacts.
The first question is how e-commerce is impacting the retail industry: Is the growth of online shopping affecting brick-and-mortar outlets and jobs? How many new jobs is e-commerce generating – both directly in e-commerce companies and indirectly in areas such as delivery?
The second question is how e-commerce is impacting the environment: What is the end-to-end CO2 equivalent (CO2e) impact? How much extra traffic is e-commerce delivery adding – and is this being offset by a reduction in car-based shopping trips? If e-commerce means more warehouses and fewer physical retail stores, are warehouses using land more or less efficiently?
Our study focuses on eight countries: France, Germany, Italy, the Netherlands, Poland, Spain, Sweden, and the United Kingdom. It is based on an analysis of official statistics, independent retailers’ surveys conducted in 2020, and a proprietary CO2e impact model.[1] The study found that retail is being transformed at different speeds across the eight focus countries. The main changes are an evolution toward more organized retail, the growth of e-commerce, and a shift in household spending from goods to services.
Economic Impact
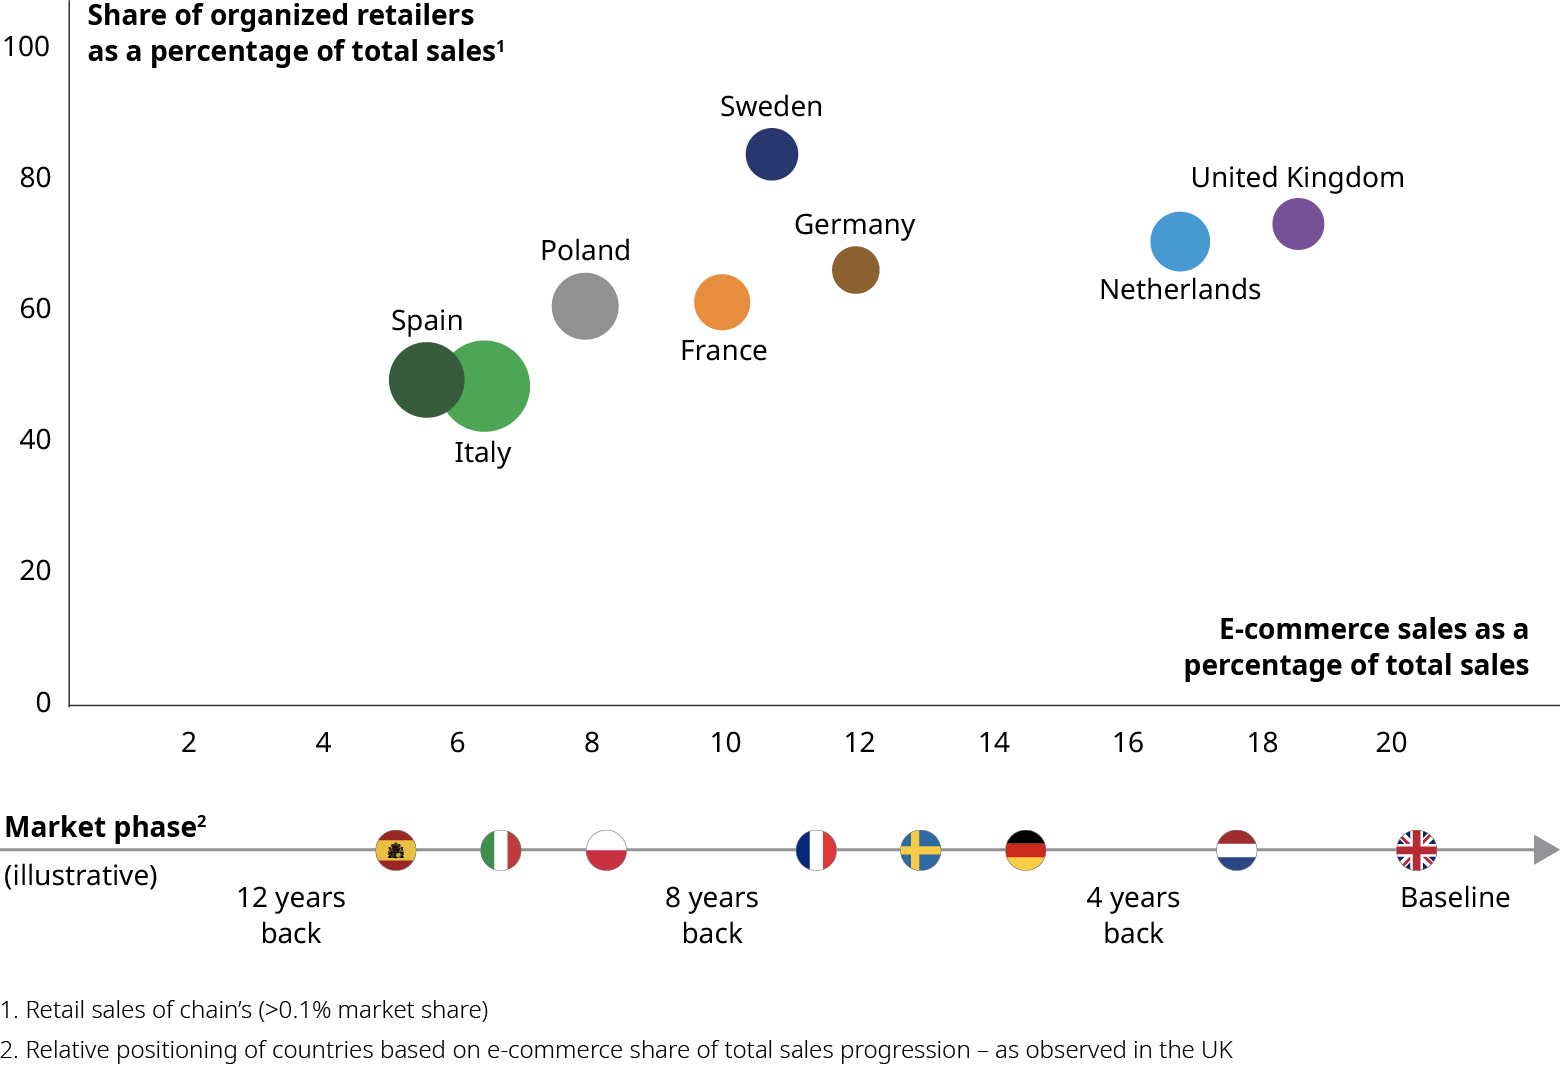
Overall, retail is gaining jobs in net terms, and e-commerce is contributing. There were fewer retail outlets in 2019 than there were in 2005, but the total store surface area remained stable, as stores grew larger. Cities that are wealthy or growing tended to increase their number of retail jobs and outlets. The e-commerce share of retail sales is higher in countries where retail is more organized, as established organized retailers have moved faster toward omnichannel retailing.

Environmental Impact
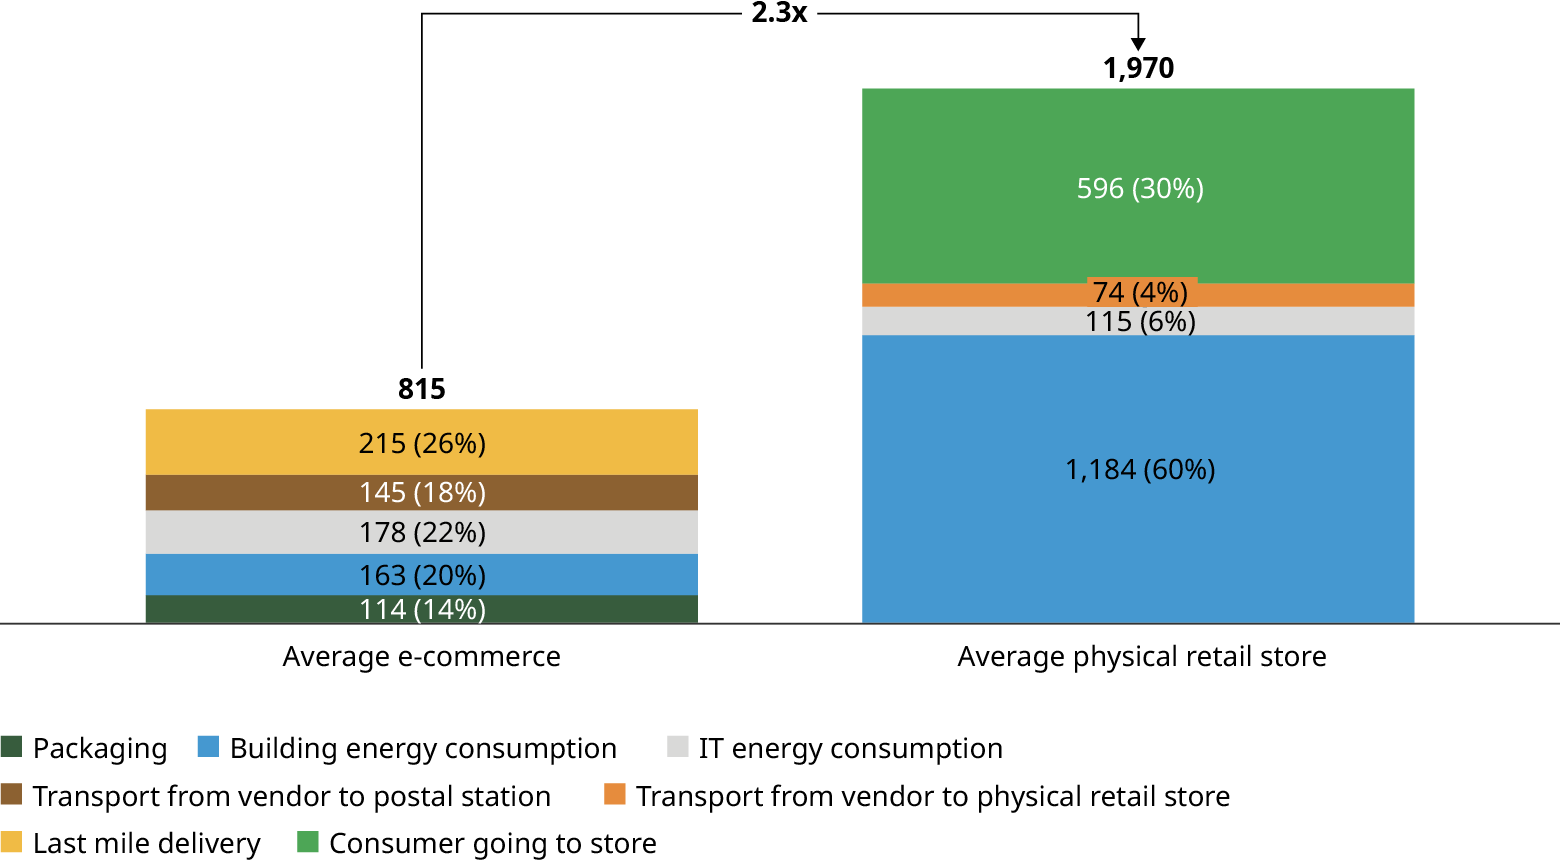
The environmental impact of e-commerce appears to be positive. Offline shopping results in between 1.5 and 2.9 times more greenhouse gas emissions than online shopping. While e-commerce needs delivery vans to circulate, these reduce car traffic by between four and nine times the amount they generate. Land use for e-commerce is lower than for physical retail, when logistics, selling space, and related parking space are included.

This report does not provide recommendations. Instead, it is intended as a source of information, as actors map out their best options.
This report is the result of an independent study led by Oliver Wyman with the support of Logistics Advisory Experts (LAE), a spin-off of the Institute of Supply Chain Management of St Gallen University. It has been conducted over a 12-week period and was commissioned by Amazon. The analysis is based on official statistics up to 2019 (unless stated otherwise) and publicly available information. The study does not use any private information from Amazon or other retailers or transport operators. Consumer behavior data is based on proprietary surveys conducted by Oliver Wyman in 2020 across Europe (France, United Kingdom, Germany, Italy, Spain).


